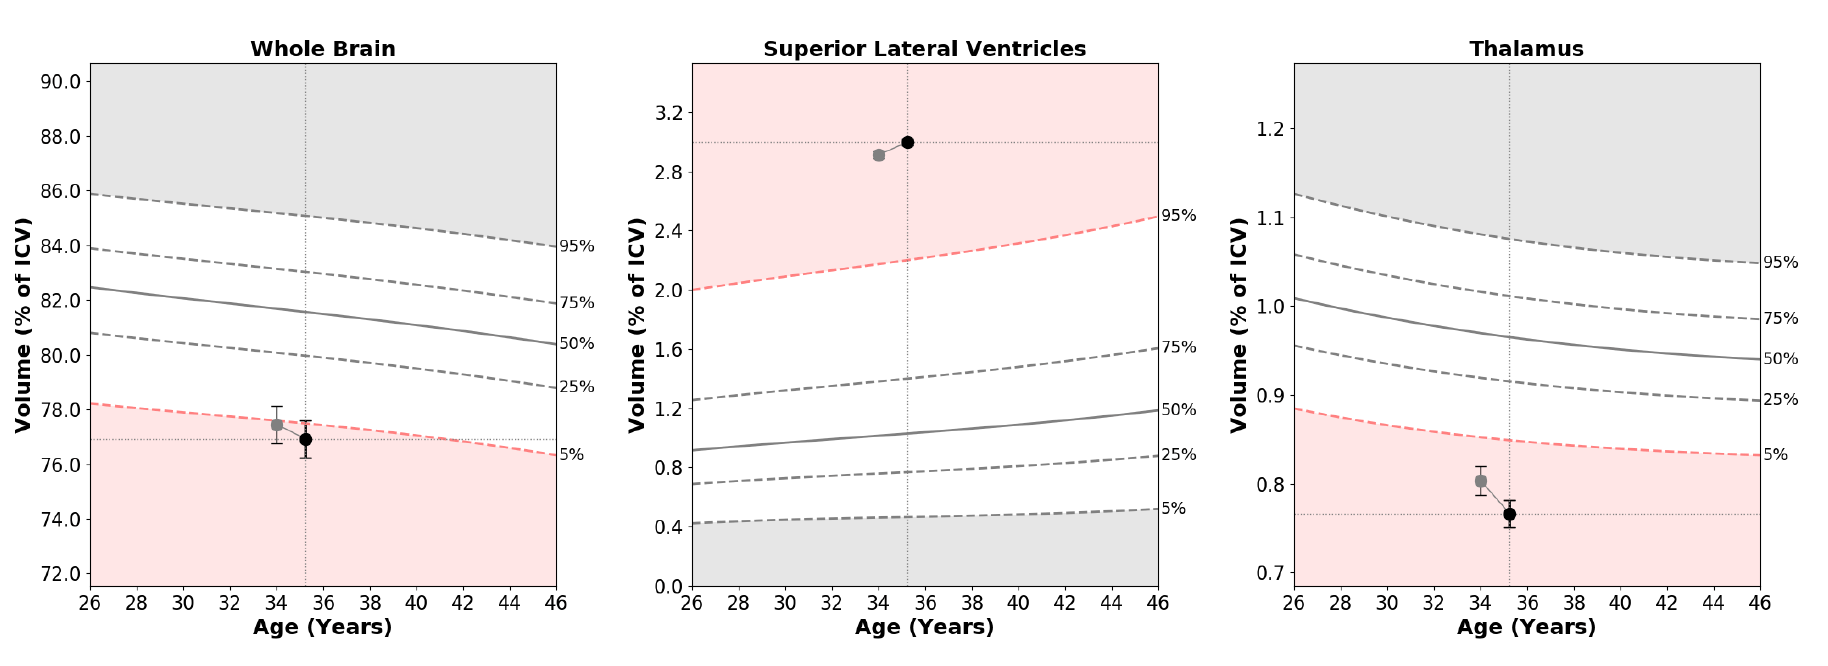
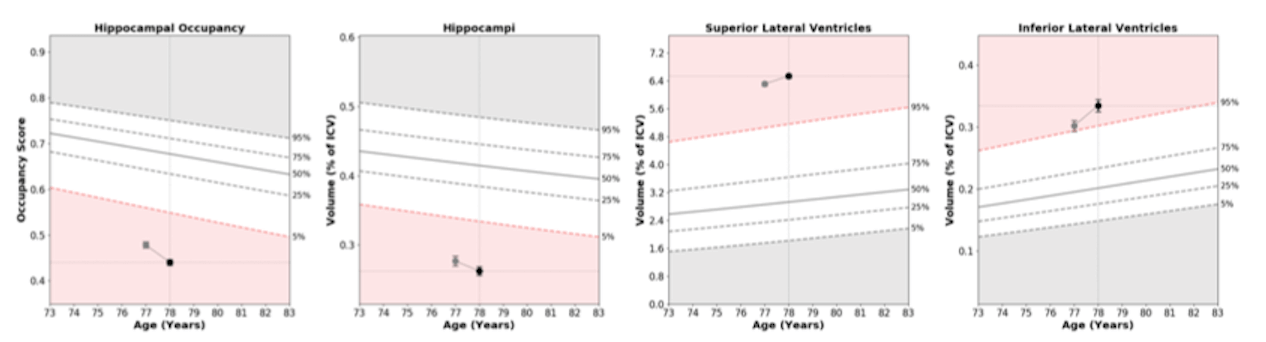
Are you taking advantage of the multi-time point plotting (longitudinal tracking) when evaluating your patients? This feature provides physicians with additional information for ongoing patient evaluation and is especially helpful in continuing care for patients with chronic neurodegeneration.
Multi-time point plotting is available for all reported structures on the NeuroQuant report when one or more previous series exist on the system with the same patient ID. For greatest reproducibility, we strongly recommend using the same scanner and protocol.
The results of current measurement (colored in black) and the prior measurements (colored in gray) are displayed on a single report allowing the physician to quickly and easily evaluate any trend in the patient’s brain volume. See examples below.
When the patient data is already in the system:
The creation of multi-time point reports occurs automatically with no user interaction for all compatible data on the system for the same patient ID.
When the patient data is no longer in the system:
To create multi-time point plots for patients with previously processed NeuroQuant output that is no longer on your system; send or upload a previous NeuroQuant report (DICOM format suffix .dcm) to NeuroQuant prior to processing the follow-up scan.
The multi-time point feature is available on the Age Related Atrophy, Hippocampal Asymmetry, Multi Structure Atrophy, Brain Development and LesionQuant reports.