When you sit down to sign off on a NeuroQuant MS or NeuroQuant Lesion Surveillance study, you want to confirm the segmentation against the images you just read, in the same plane, the same slice positions, and the same orientation. That is what native space outputs give you in v5.3.0. Rather than aligning results to a standard atlas, NeuroQuant now returns the segmentation in the same space as your acquired images: the T2 FLAIR for NeuroQuant MS, and the T2*GRE or SWI for NeuroQuant Lesion Surveillance. Each output is delivered as a standard MR image object that preserves the position information from your input series, so at the workstation you can open the original study and the segmented series side by side and scroll through them together, slice for slice, without any mental re-registration.
For NeuroQuant MS, that means the lesion segmentation lands directly on the T2 FLAIR you acquired. You can move through the stack and check, slice by slice, that what the model marked matches what you see, and just as importantly, that it did not miss or over-call anything. Because the segmentation shares the input geometry, the review reads the way you already work.
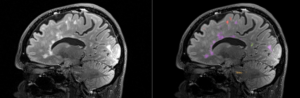

Figure 1. NeuroQuant MS. Left: acquired T2 FLAIR input. Right: the lesion segmentation returned in native space, overlaid in the same slice position and orientation as the input.
The same is true for NeuroQuant Lesion Surveillance, where the SWI or T2*GRE input stays exactly as scanned and the microhemorrhage segmentation sits in that same space. This matters most for the small findings. Confirming a few punctate hemorrhages is far easier when the marked voxels line up precisely with the susceptibility signal on your original slice rather than on a reoriented copy. It is worth noting what this replaces: before v5.3.0, results were aligned to the atlas, so we had to send a copy of your input images aligned to the atlas alongside the segmentation aligned to the atlas, just to give you something to compare against. Native space removes that extra pair of series, so there is less to sort through in your worklist and the comparison is against your own acquisition.
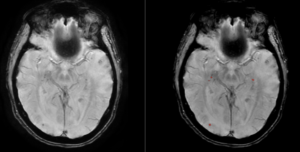

Figure 2. NeuroQuant Lesion Surveillance. Left: acquired SWI input. Right: the microhemorrhage segmentation returned in native space, aligned to the same slice.
Longitudinal studies follow the same principle. When NeuroQuant reports change over time, the series depicting those changes is aligned to the input images for the current timepoint, so lesion counts and the comparison of current against baseline always map back to the study on your screen. Native space outputs are on by default for both NeuroQuant MS and NeuroQuant Lesion Surveillance, so there is nothing to configure. The results arrive in the space where you already read.
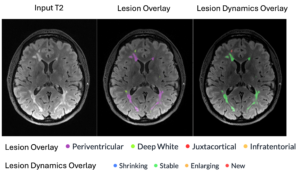
Figure. A followup study processed using NeuroQuant MS. The input series was acquired sagitally. All the images have been resliced. Left: input series, middle: LQRegional (color segmentations for the timepoint), right: LQChangeType (Lesion segmentations depicting the type of change from the prior)
Native space outputs came directly from listening to how clinicians actually read these studies, and that is how we like to work. We are always glad to hear from the people using NeuroQuant day to day, and as your needs change, we will keep building the solutions that fit the way you practice. If there is something that would make your workflow better, tell us. We are listening.