Quantitative MRI imaging has proven its usefulness in the clinical characterization of neurodegenerative disorders. It is a powerful tool in analyzing brain volumetrics and providing surveillance of volumes to assess patient condition over time. NeuroQuant software offers 5 standard, disease-specific reports to evaluate brain structures often associated with those disease processes. In addition to standard reports, NeuroQuant software also offers a custom report capability, where users can choose 9 structures of interest per report. With the ability to select structures from NeuroQuant’s 70+ structure parcellation atlas, the user has the power to truly personalize patient care!
1. What Are NeuroQuant Custom Reports?
NeuroQuant’s custom report option allows users to configure the content and emphasis of volumetric results by selecting customized structures for segmentation.
NeuroQuant custom reports allow end users such as imaging centers, referring providers, research organizations, and neuroradiologists to tailor reports to specific diagnostic regions of interest. Custom reports afford an opportunity to support clinical workflow, enhance referrals, and evaluate imaging biomarkers of neurologic conditions not directly associated with standard NeuroQuant reports.
This flexibility allows for targeted reporting, whether you’re assessing neuropsychiatric disorders like ADHD, anxiety, PTSD, or overall wellness.
2. How Can NeuroQuant Custom Reports be Used?
Custom reports let you prioritize what’s clinically relevant:
- Cortical gray matter volumes in the regions of ventromedial prefrontal/medial orbitofrontal, inferior temporal, and dorsal anterior cingulate has been shown to differ in subjects diagnosed with neuropsychiatric disorders such as ADHD, ASD, bipolar disorder, and anxiety compared to the normative population [1]
- Adults with major depressive disorder (MDD) have been shown to have thinner cortical gray matter than controls in the orbitofrontal cortex (OFC), anterior and posterior cingulate, insula and temporal lobe. [2]
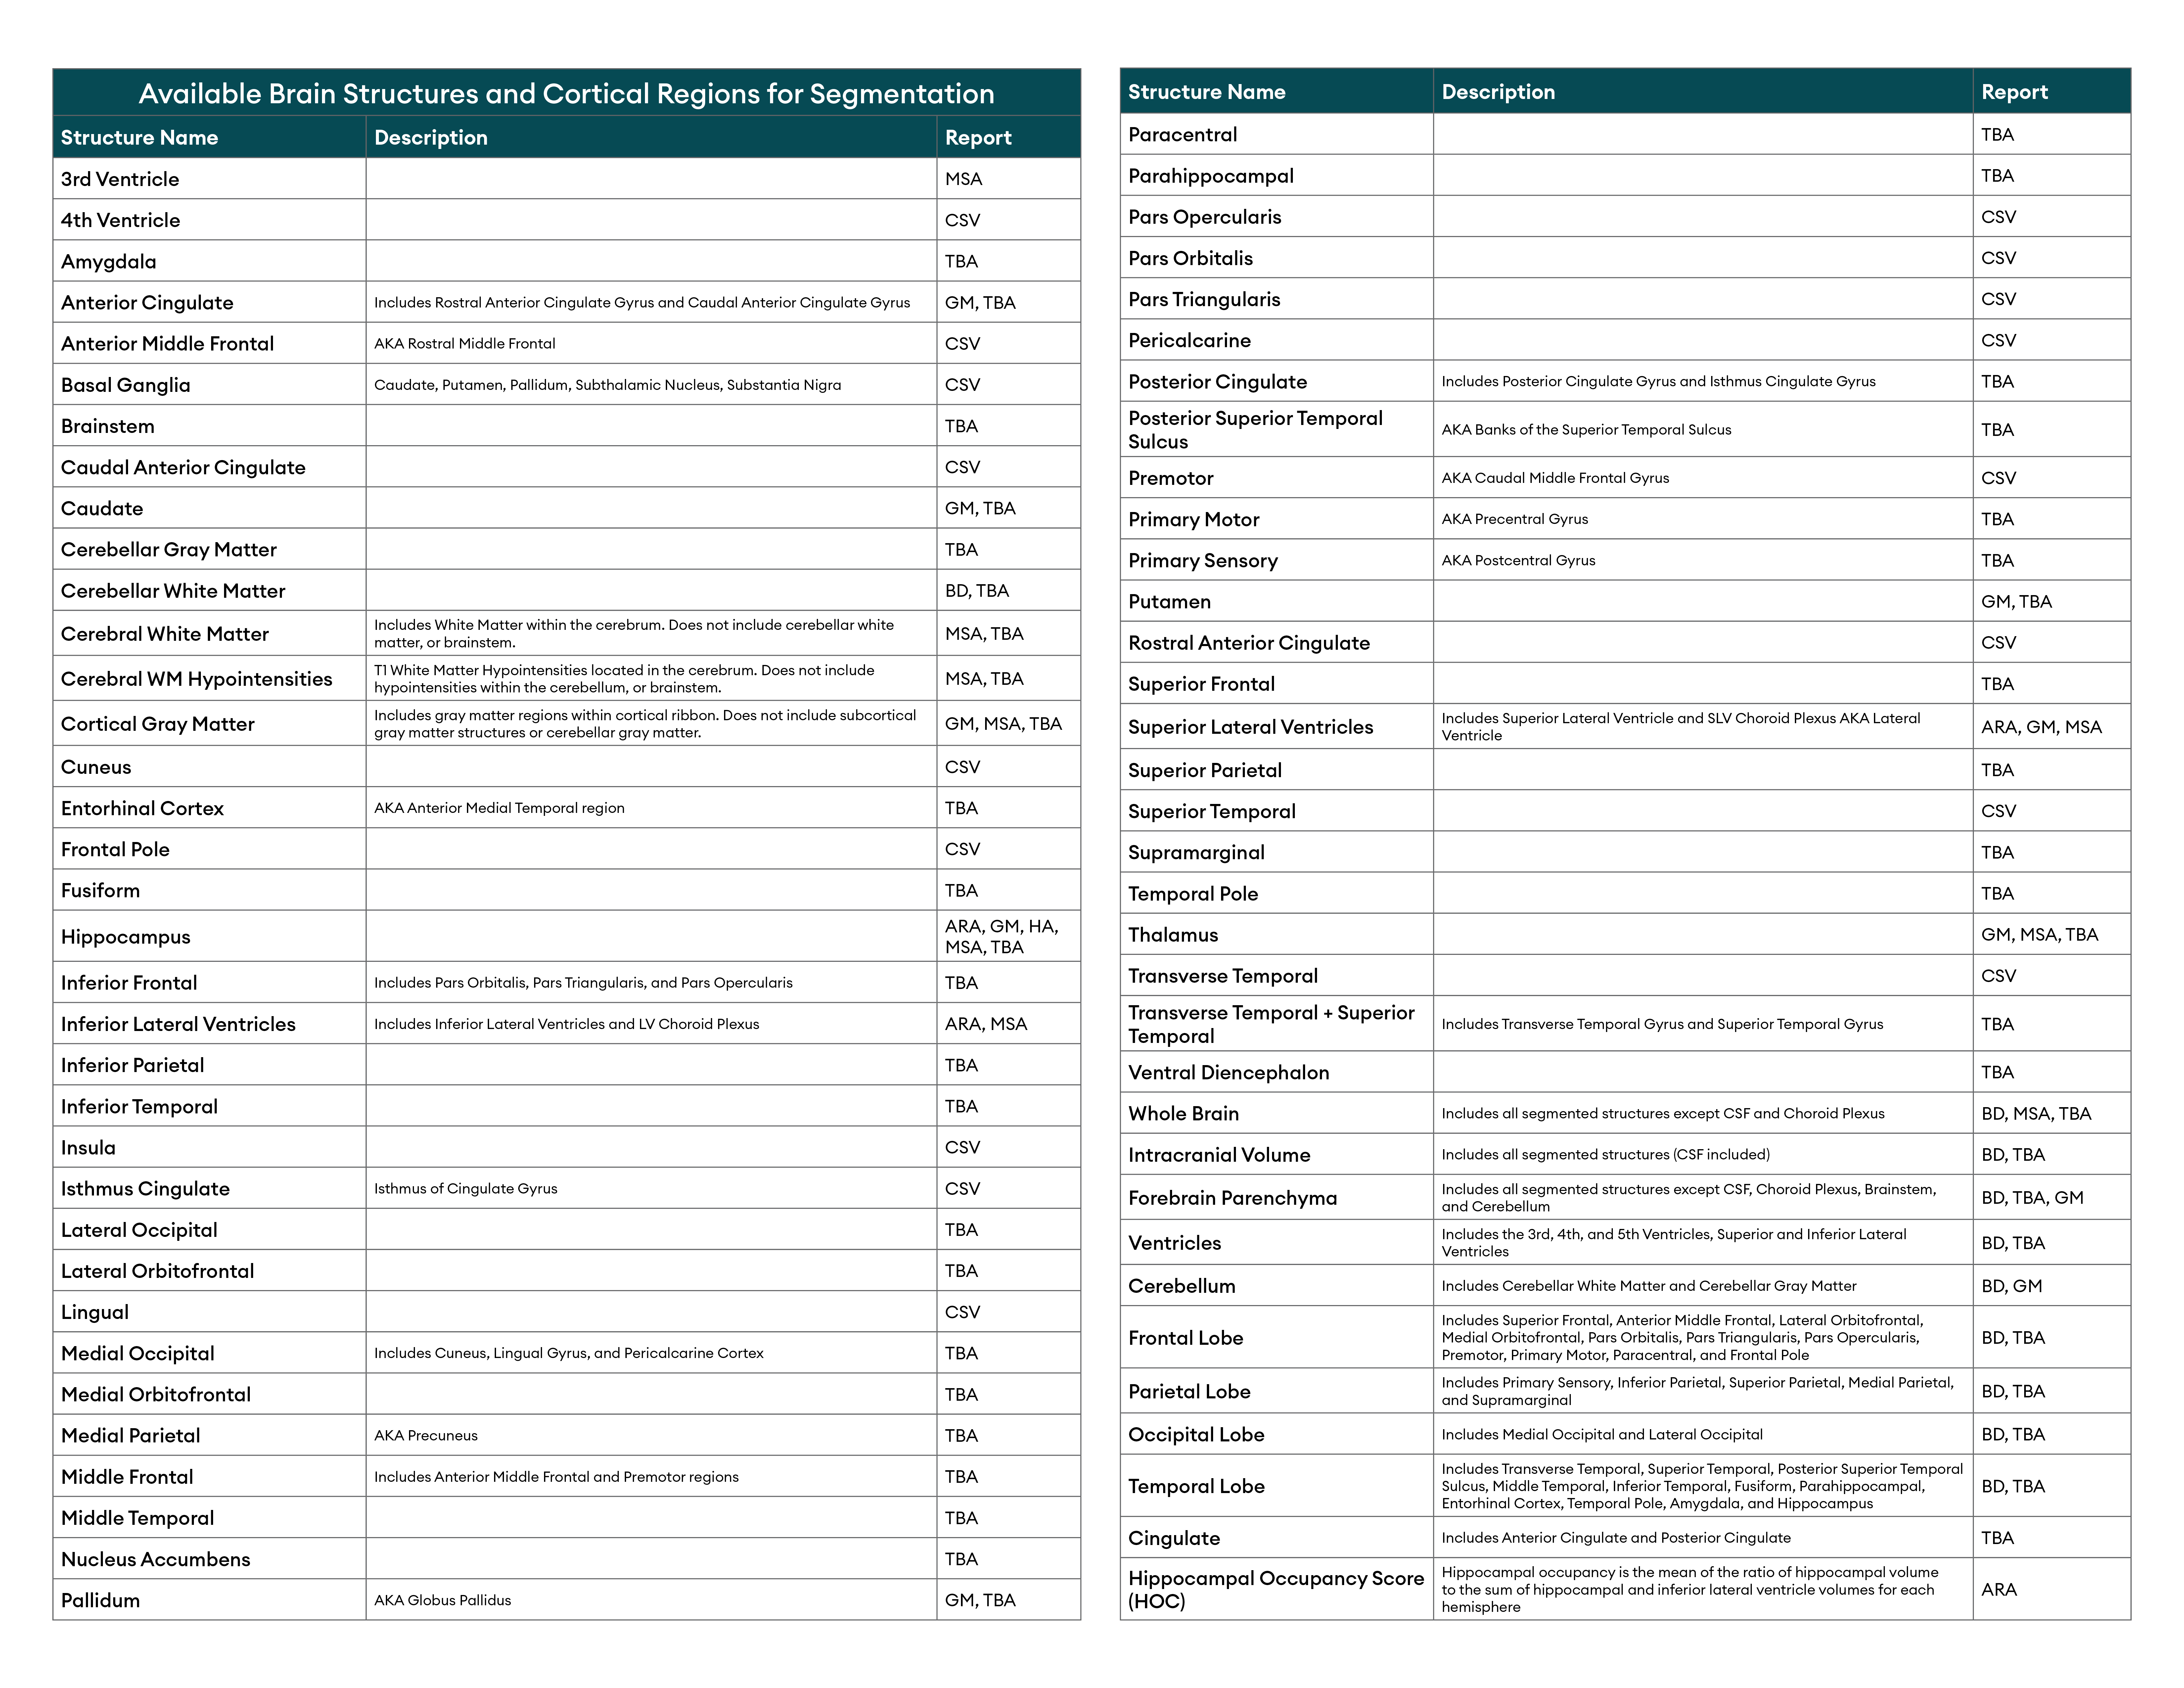
Focused attention to structure volumes associated with neurologic disorders can help physicians understand patient conditions from a quantitative perspective. NeuroQuant’s extensive list of available structures for parcellation makes evaluation of patient condition quite comprehensive. The available structures are listed in the table below:
3. Supporting Longitudinal Tracking
NeuroQuant’s custom templates can be optimized to highlight serial changes in volume over time, which is particularly useful for monitoring neurodegenerative disease progression.
Incorporating comparisons to age and gender matched normative data in NeuroQuant custom reports makes trend analysis fast and effective. Comparisons to the normative population provide a more comprehensive overview of volumetric data in a vast array of neurologic conditions.
4. Sample Report
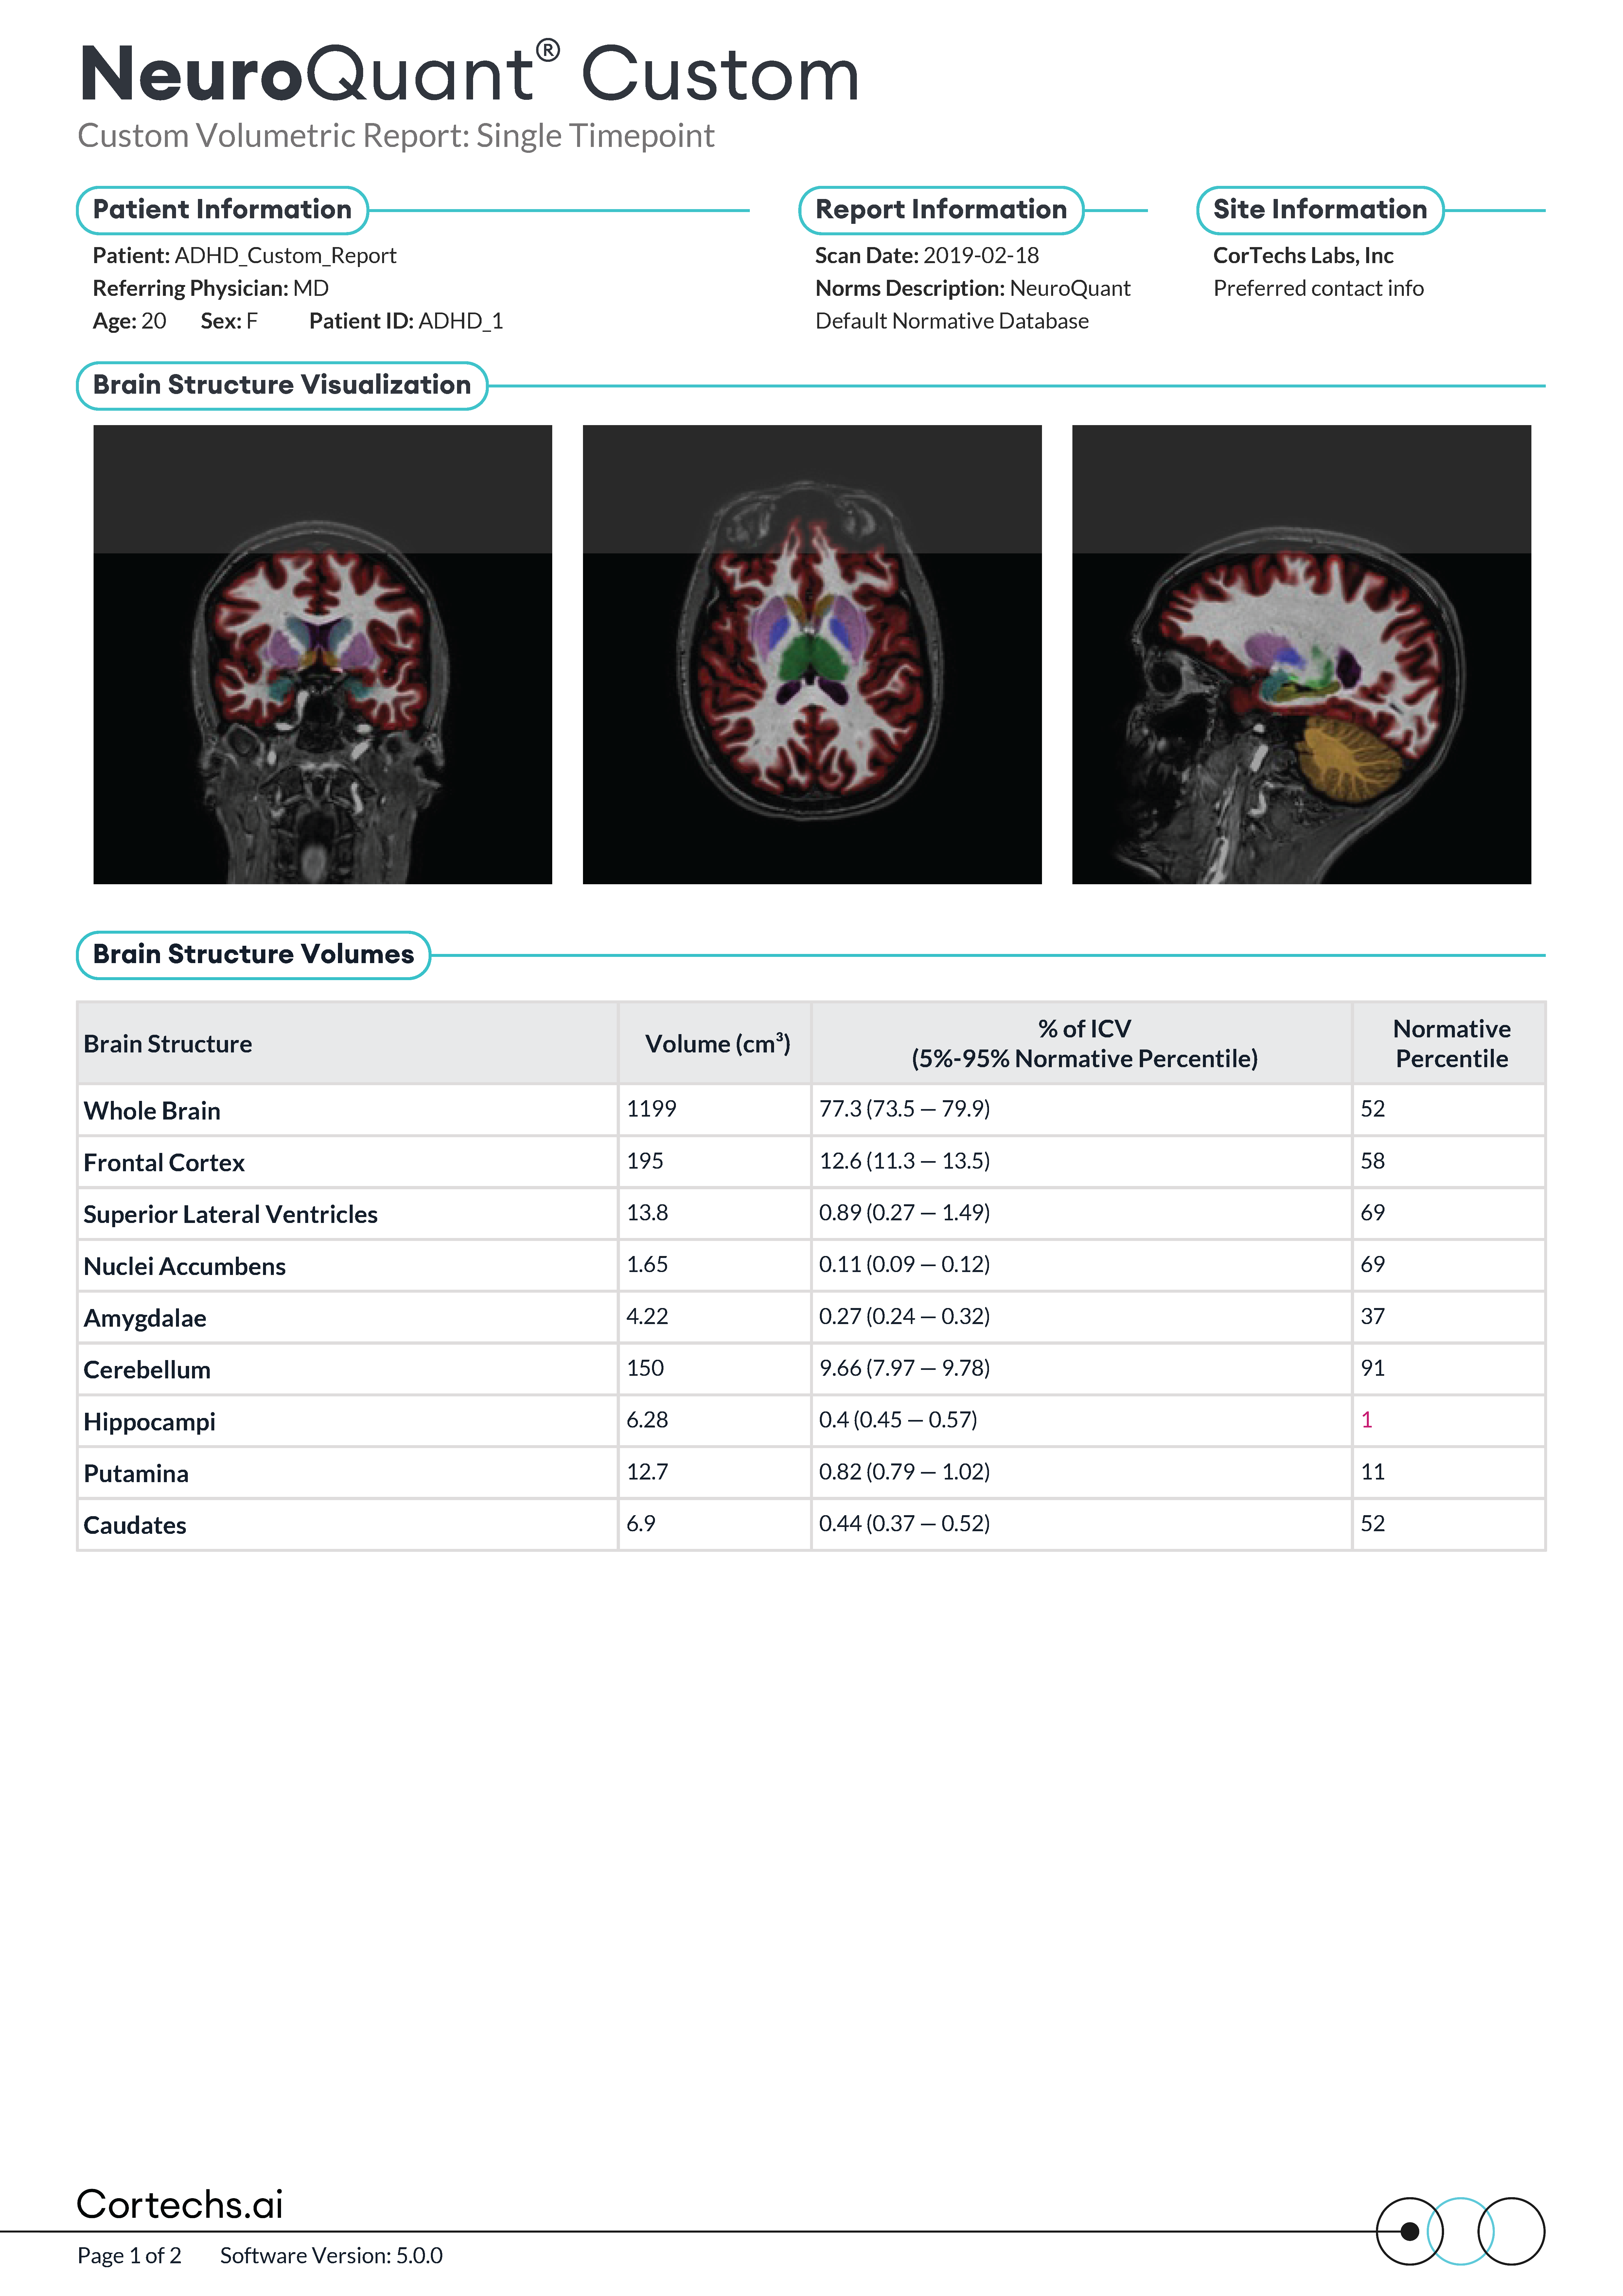
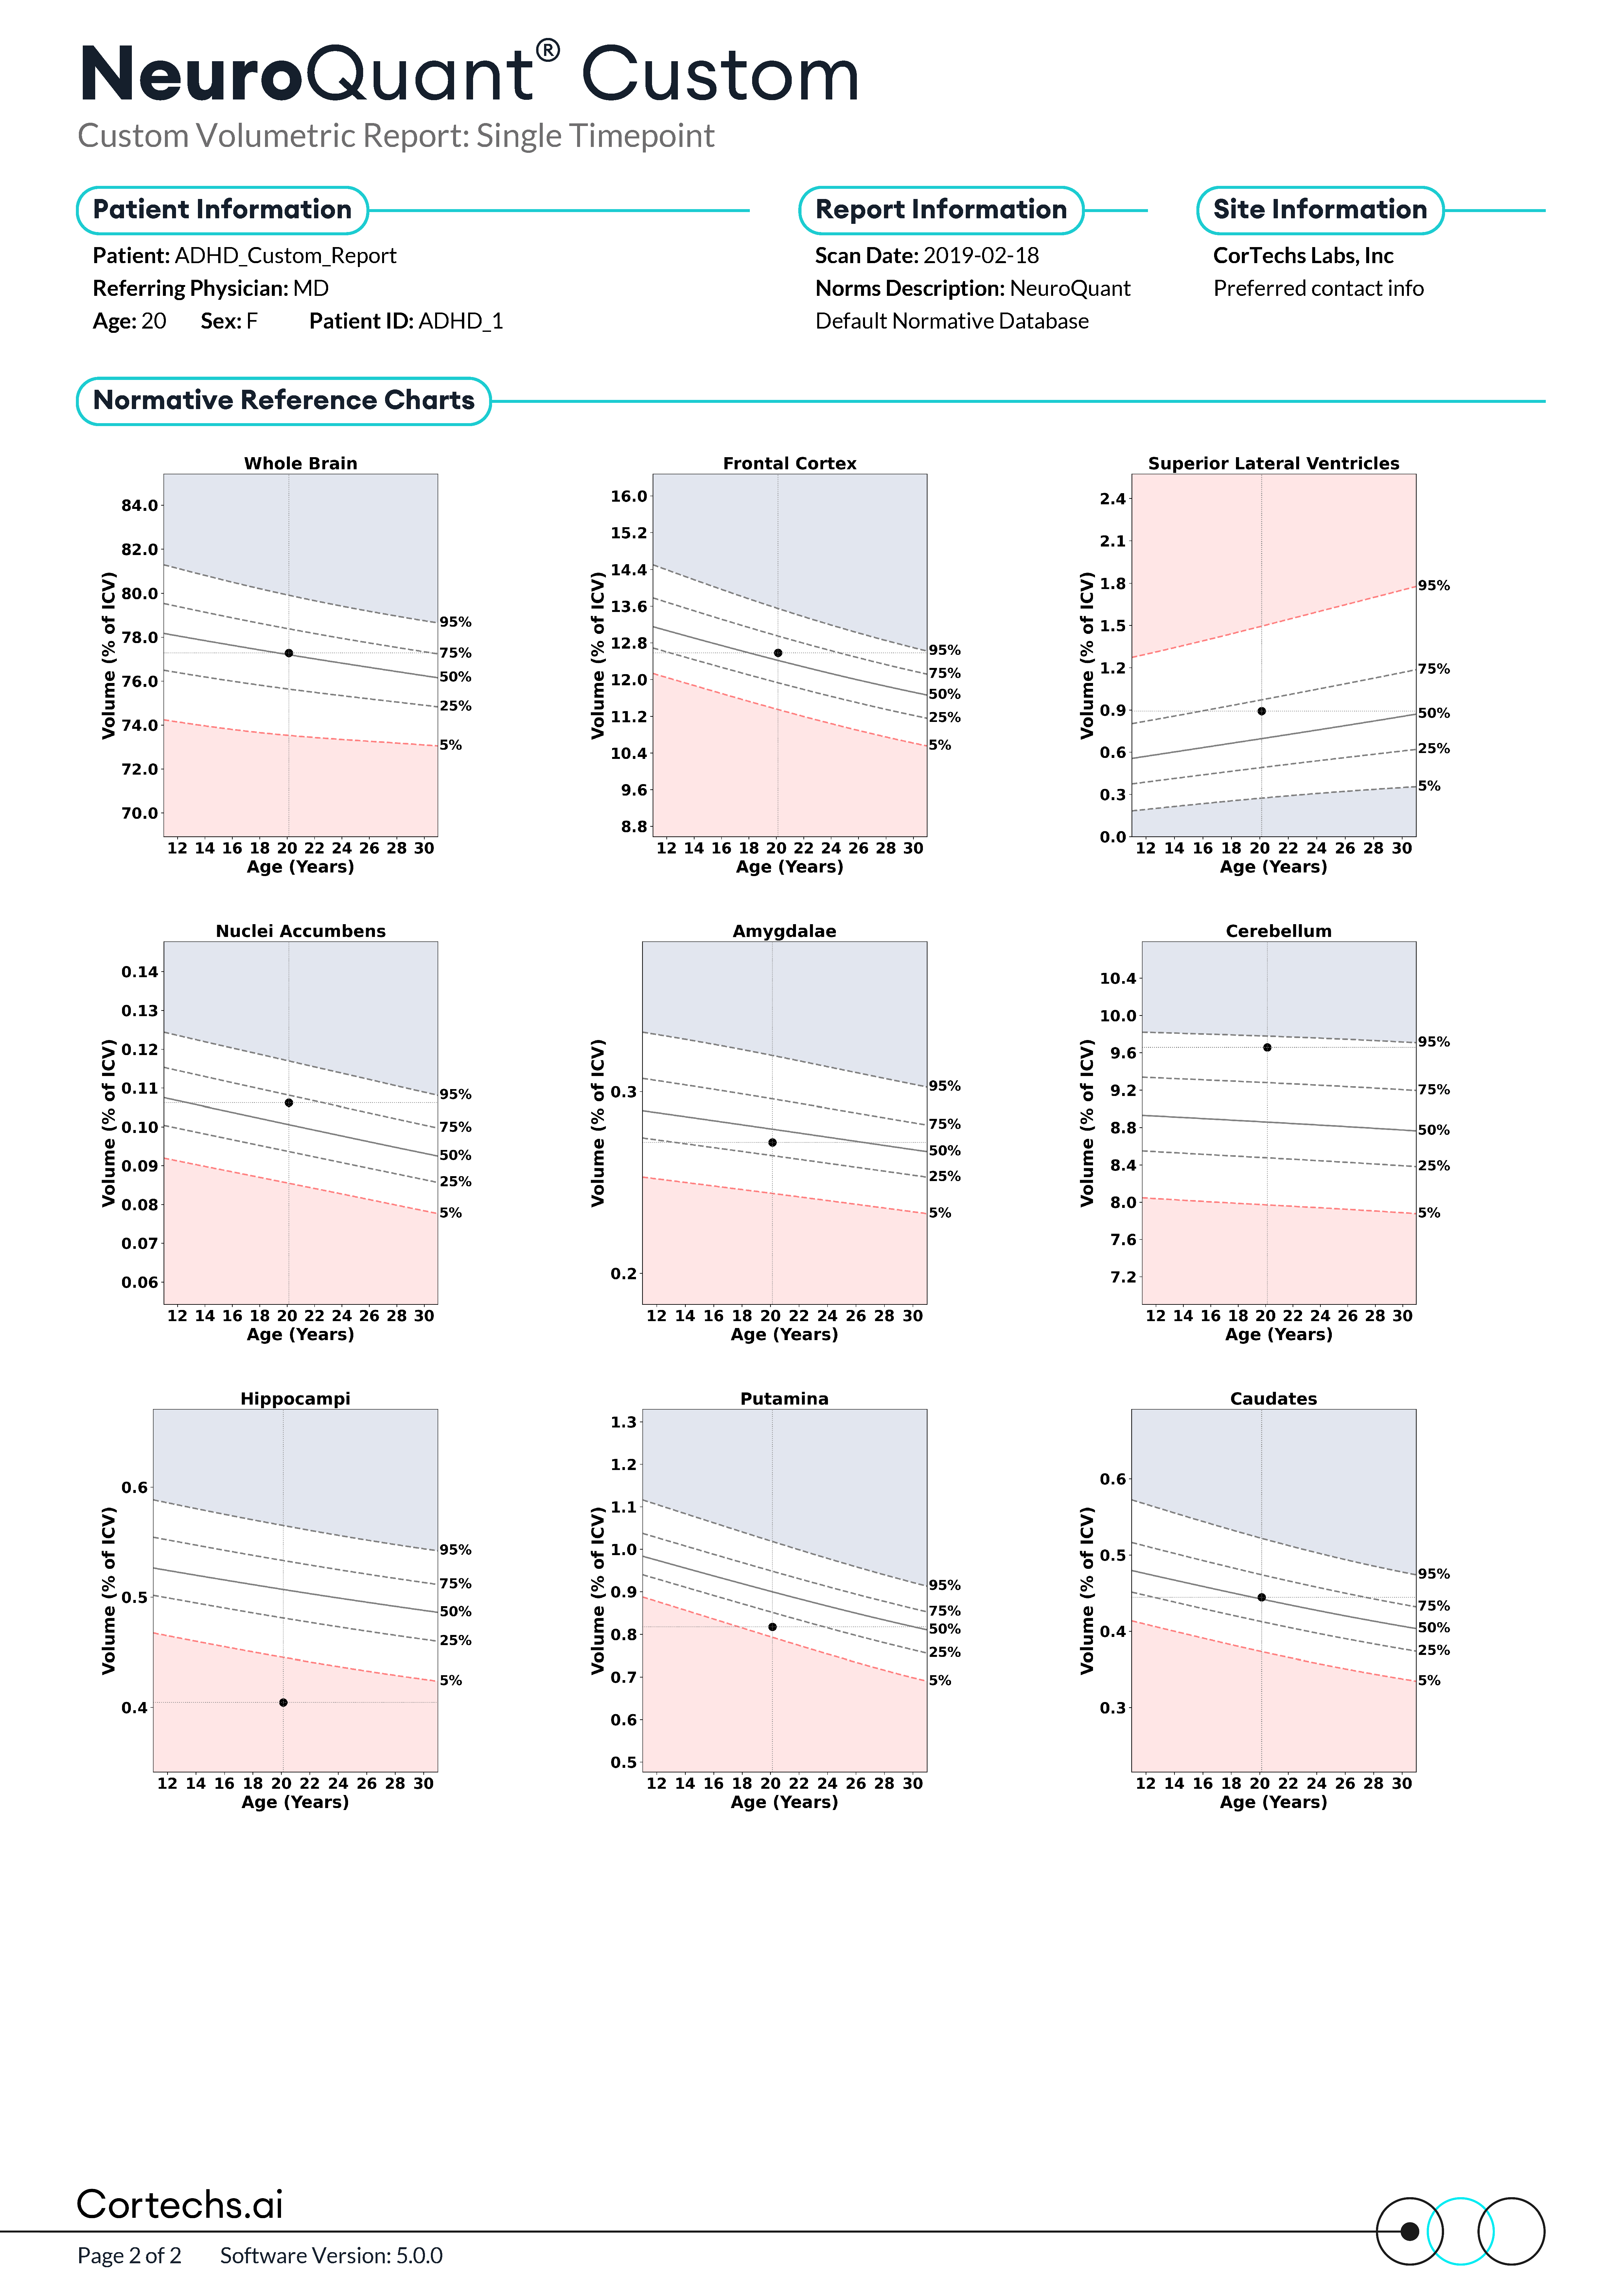
A physician treating a patient with a confirmed diagnosis of ADHD requested a NeuroQuant Custom Report to further evaluate the volumes of specific brain structures associated with attention and executive function. Below is the resulting report, followed by a sample interpretation that illustrates how NeuroQuant informs the clinician’s understanding of the neurological profile.
NeuroQuant ADHD Custom Report Findings
The hippocampal volume is 6.28cm3, which is statistically significant for patient age and sex (1st percentile).
All other included structures are within the normative 5th – 95th percentile range for age and sex.
Impression
Volumetric analysis demonstrates statistically significant low hippocampal volume. All other structures are within normal limits. Further diagnostics are recommended to evaluate the low hippocampal volume.
5. Objective and Consistent Results
Custom reports can also aid in maintaining consistency for:
- Clinical trials
- Memory clinics
- Research organizations
- Specialist providers, such as psychiatry and psychology
- Wellness and alternative medicine providers
By using standardized templates, practices can ensure consistent metrics across sites or time points, which is critical for continuity of results and clinical decision-making.
Conclusion
NeuroQuant’s power lies not just in its advanced segmentation algorithms, but in the ability to customize and contextualize that data. By utilizing custom reports thoughtfully, clinicians and imaging professionals can translate raw volumes into actionable insights, improving diagnostic confidence, communication, and patient outcomes.
References
[1] Castellanos FX. A biased perspective on brain imaging of ADHD. Am J Psychiatry. 2021;178(8):715-717. doi:10.1176/appi.ajp.2021.21060609
[2] Schmaal L, Hibar DP, Sämann PG, et al. Cortical abnormalities in adults and adolescents with major depression based on brain scans from 20 cohorts worldwide in the ENIGMA Major Depressive Disorder Working Group. Mol Psychiatry. 2017;22(6):900-909. doi:10.1038/mp.2016.60

