With the new release of NeuroQuant® 3.0, users will now have access to the change visualization output, previously available only through LesionQuant. Now compare two 3D T1 scans to detect and highlight the volumetric change within an easy to interpret heat map overlay. Users will see voxel-specific changes between the two scans highlighted in a color-coded heat map returned to the PACS system as a DICOM volume. The detailed 3D overlay provides high-resolution images to inform physicians of very subtle changes such as ventricle expansion, tissue atrophy and swelling that would otherwise be undetected by the human eye.
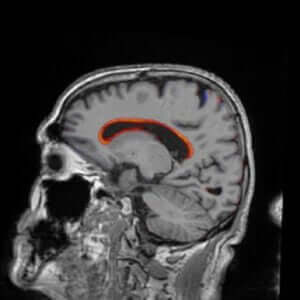
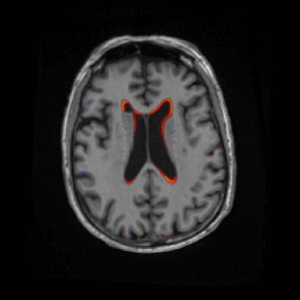
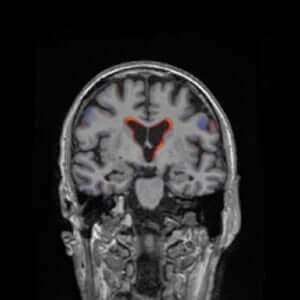
The change analysis also highlights areas of significant volume changes that may be a result of medication, injury, or disease progression. This output fully integrates into the existing workflow and provides a DICOM overlay of co-registered and aligned images between time points.
To generate a change visualization output for NeuroQuant® or LesionQuant, the raw data from the baseline scan must be available in the NeuroQuant® database. If the baseline data is available, NeuroQuant® and LesionQuant will automatically generate change visualization outputs if the scan protocols are comparable. If baseline data is not available, the user will upload the baseline scan 3D T1 (and FLAIR for LesionQuant) for analysis, then upload the current time point data.
NeuroQuant® 2.3 will continue to be available to all customers however all new features will only be available with NeuroQuant® 3.0. Learn more about the new and improved features NeuroQuant® 3.0 can bring to you and your patients.
Ready to upgrade to 3.0? Click here to request migration to NeuroQuant® 3.0.


