 On March 9, 2016, Cortechs.ai launched a new research product: PETQuant™. PETQuant provides automated and fast post-acquisition analyses of PET brain studies to quantify subregional tracer binding in native patient brain space, and is compatible with metabolic (FDG) and amyloid-based (florbetapir) tracers.
PETQuant expands the use of NeuroQuant®’s proven and trusted segmentation technology by offering an additional research tool in the evaluation of neurodegenerative dementias, such as Alzheimer’s disease and frontotemporal dementia.
Fast, Accurate and Simplified Quantitative Phenotyping
PETQuant enables clinical researchers to perform post-acquisition analyses of PET brain studies to quantify subregional tracer binding in native patient brain space
Powered by NeuroQuant
PET tracer bindings are accurately localized to brain structures identified by NeuroQuant 3D T1 MRI segmentation
Completely Automatic
PETQuant offers fully automated and consistent results
Fast and Reliable Quantitative Data
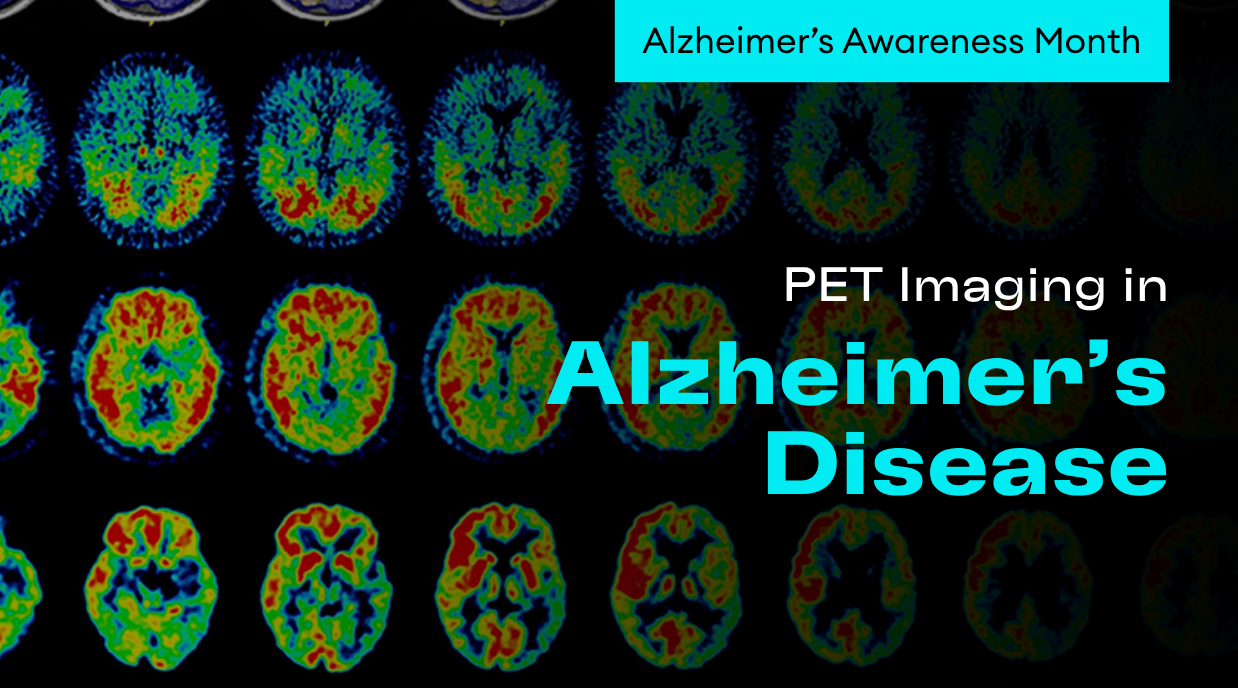
In about 10 minutes, PETQuant returns a complete report with color overlay and quantitative information for 46 brain structures, for both left and right hemispheres
Amyloid Deposition and Metabolism Analysis
PETQuant provides two separate reports that correspond to the PET tracer used; choose between metabolic (FDG) and amyloid-based (florbetapir) analysis reports
Simplified and Easy-to-Read
Color-coded graphical presentation simplifies quantitative reads
Available Anytime, Anywhere
Secure, cloud-based system provides access anytime, from virtually anywhere
This version of PETQuant is for research purposes only.
For more information on PETQuant or to schedule a demo, visit cortechs.ai/petquant or contact us.
