Did you know that the LesionQuant module offers lesion and brain structure change data for review?
Lesion and brain structure change data is available when a current and prior LesionQuant study have been processed and are available in the system. Change values of lesions are determined by using both 3D T1 and (2D or 3D) T2 FLAIR MRIs.
Morphometry Results
The change calculation of brain structures provides the difference between the current and prior scan brain volumes, % ICV and normative percentile.
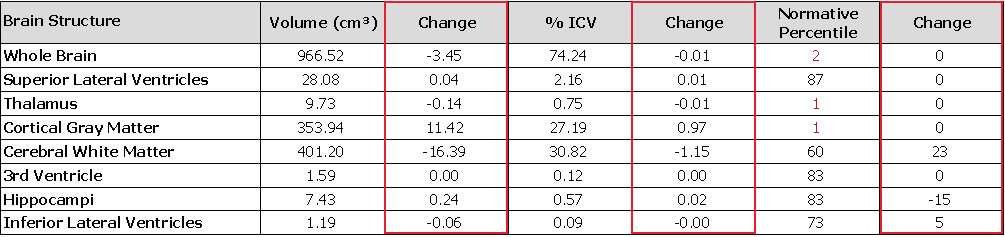
Multi time point plotting displays the current and prior measurements on the same report, allowing for ongoing patient evaluation with longitudinal tracking.
Lesion Results
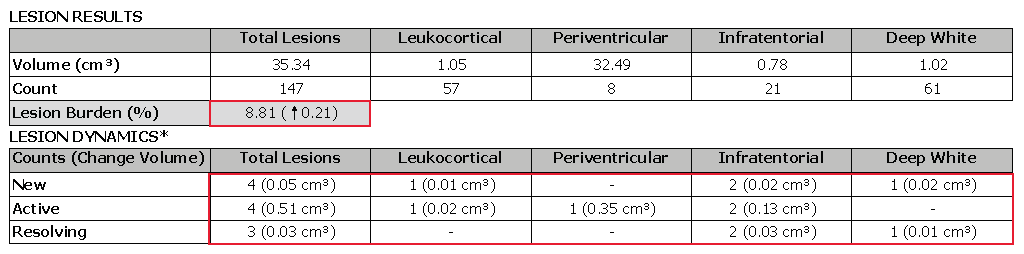
- Evaluate lesion burden change
- Review new, enlarging and resolving lesion counts and volumes
- Evaluate where new and enlarging lesions are anatomically located
- Review the lesion change summary for a written evaluation of the change between two time points
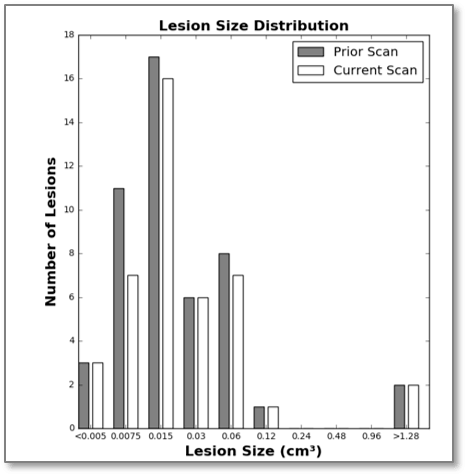
Lesion Size Distribution Histogram
The histogram of lesion size distribution displays number of lesions within each lesion size bracket for current and prior scans. This data can characterize global lesion changes and provide an indication of disease progression.
Reproducibility and Comparison Best Practices
It is best practice to perform the current MRI on the same MRI scanner and series protocol as the prior MRI. If different scanners and/or protocols are used, caution should be taken when interpreting the results.
When patient data is already in the system
If an earlier scan for the patient has been processed by LesionQuant (same software version) and is available in the system, change volume images are automatically included in the output sent to the PACS/DICOM Viewer. The PatientID must match on both time points, and the StudyInstanceUID must match on the individual T1/FLAIR pair.
When patient data is no longer in the system or there has been a change in the software version from the current scan
To obtain the change visualization, the user must reprocess the prior scan pair, then send the current scan pair for processing to receive the change analysis and volumes. The PatientID must match on both time points, and the StudyInstanceUID must match on the individual T1/FLAIR pair.
If the prior study is sent to LesionQuant for comparison reprocessing, it is important that the prior T1/FLAIR pair is processed completely before submitting the current T1/FLAIR pair.