- NeuroQuant®
Brain segmentation and volumetric analysis for patients with neurodegenerative diseases
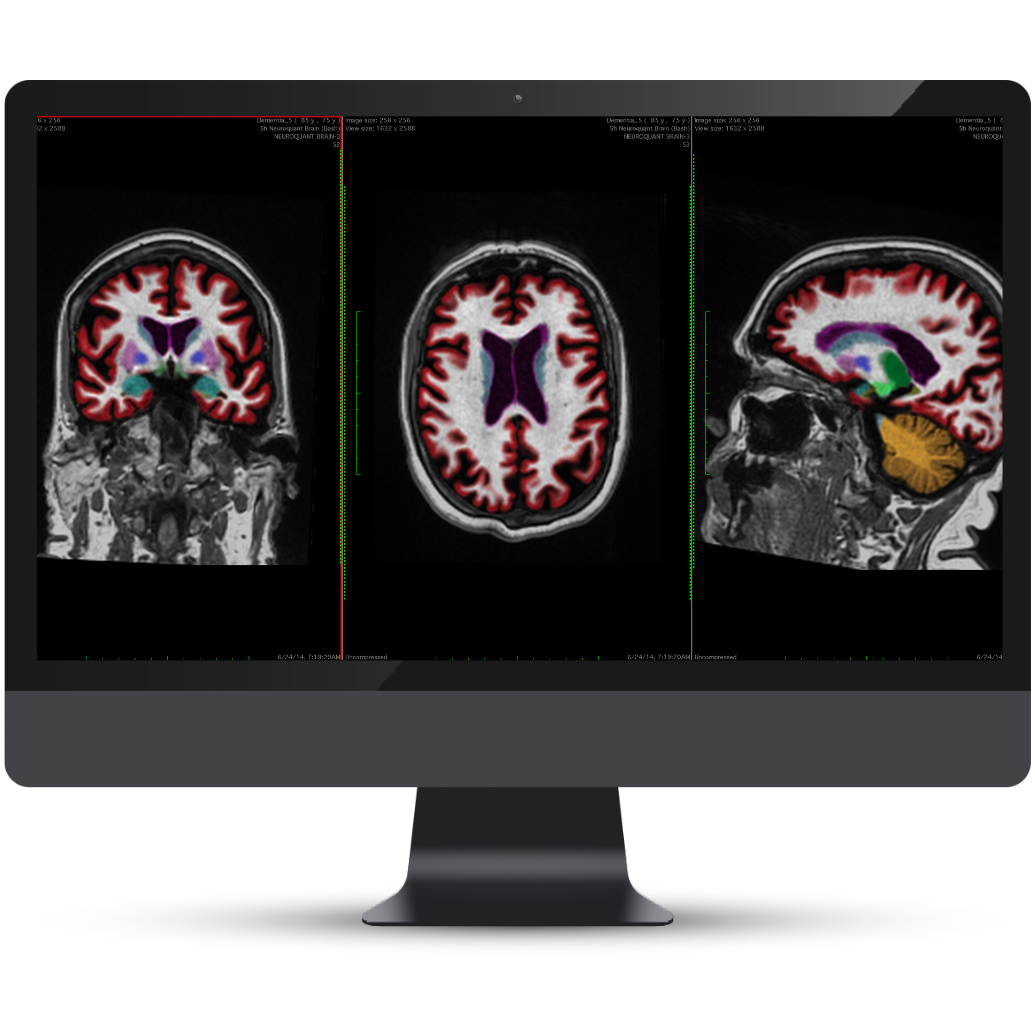
Identify and assess neurodegeneration in its earliest stages
NeuroQuant Reports
Age-Related Atrophy
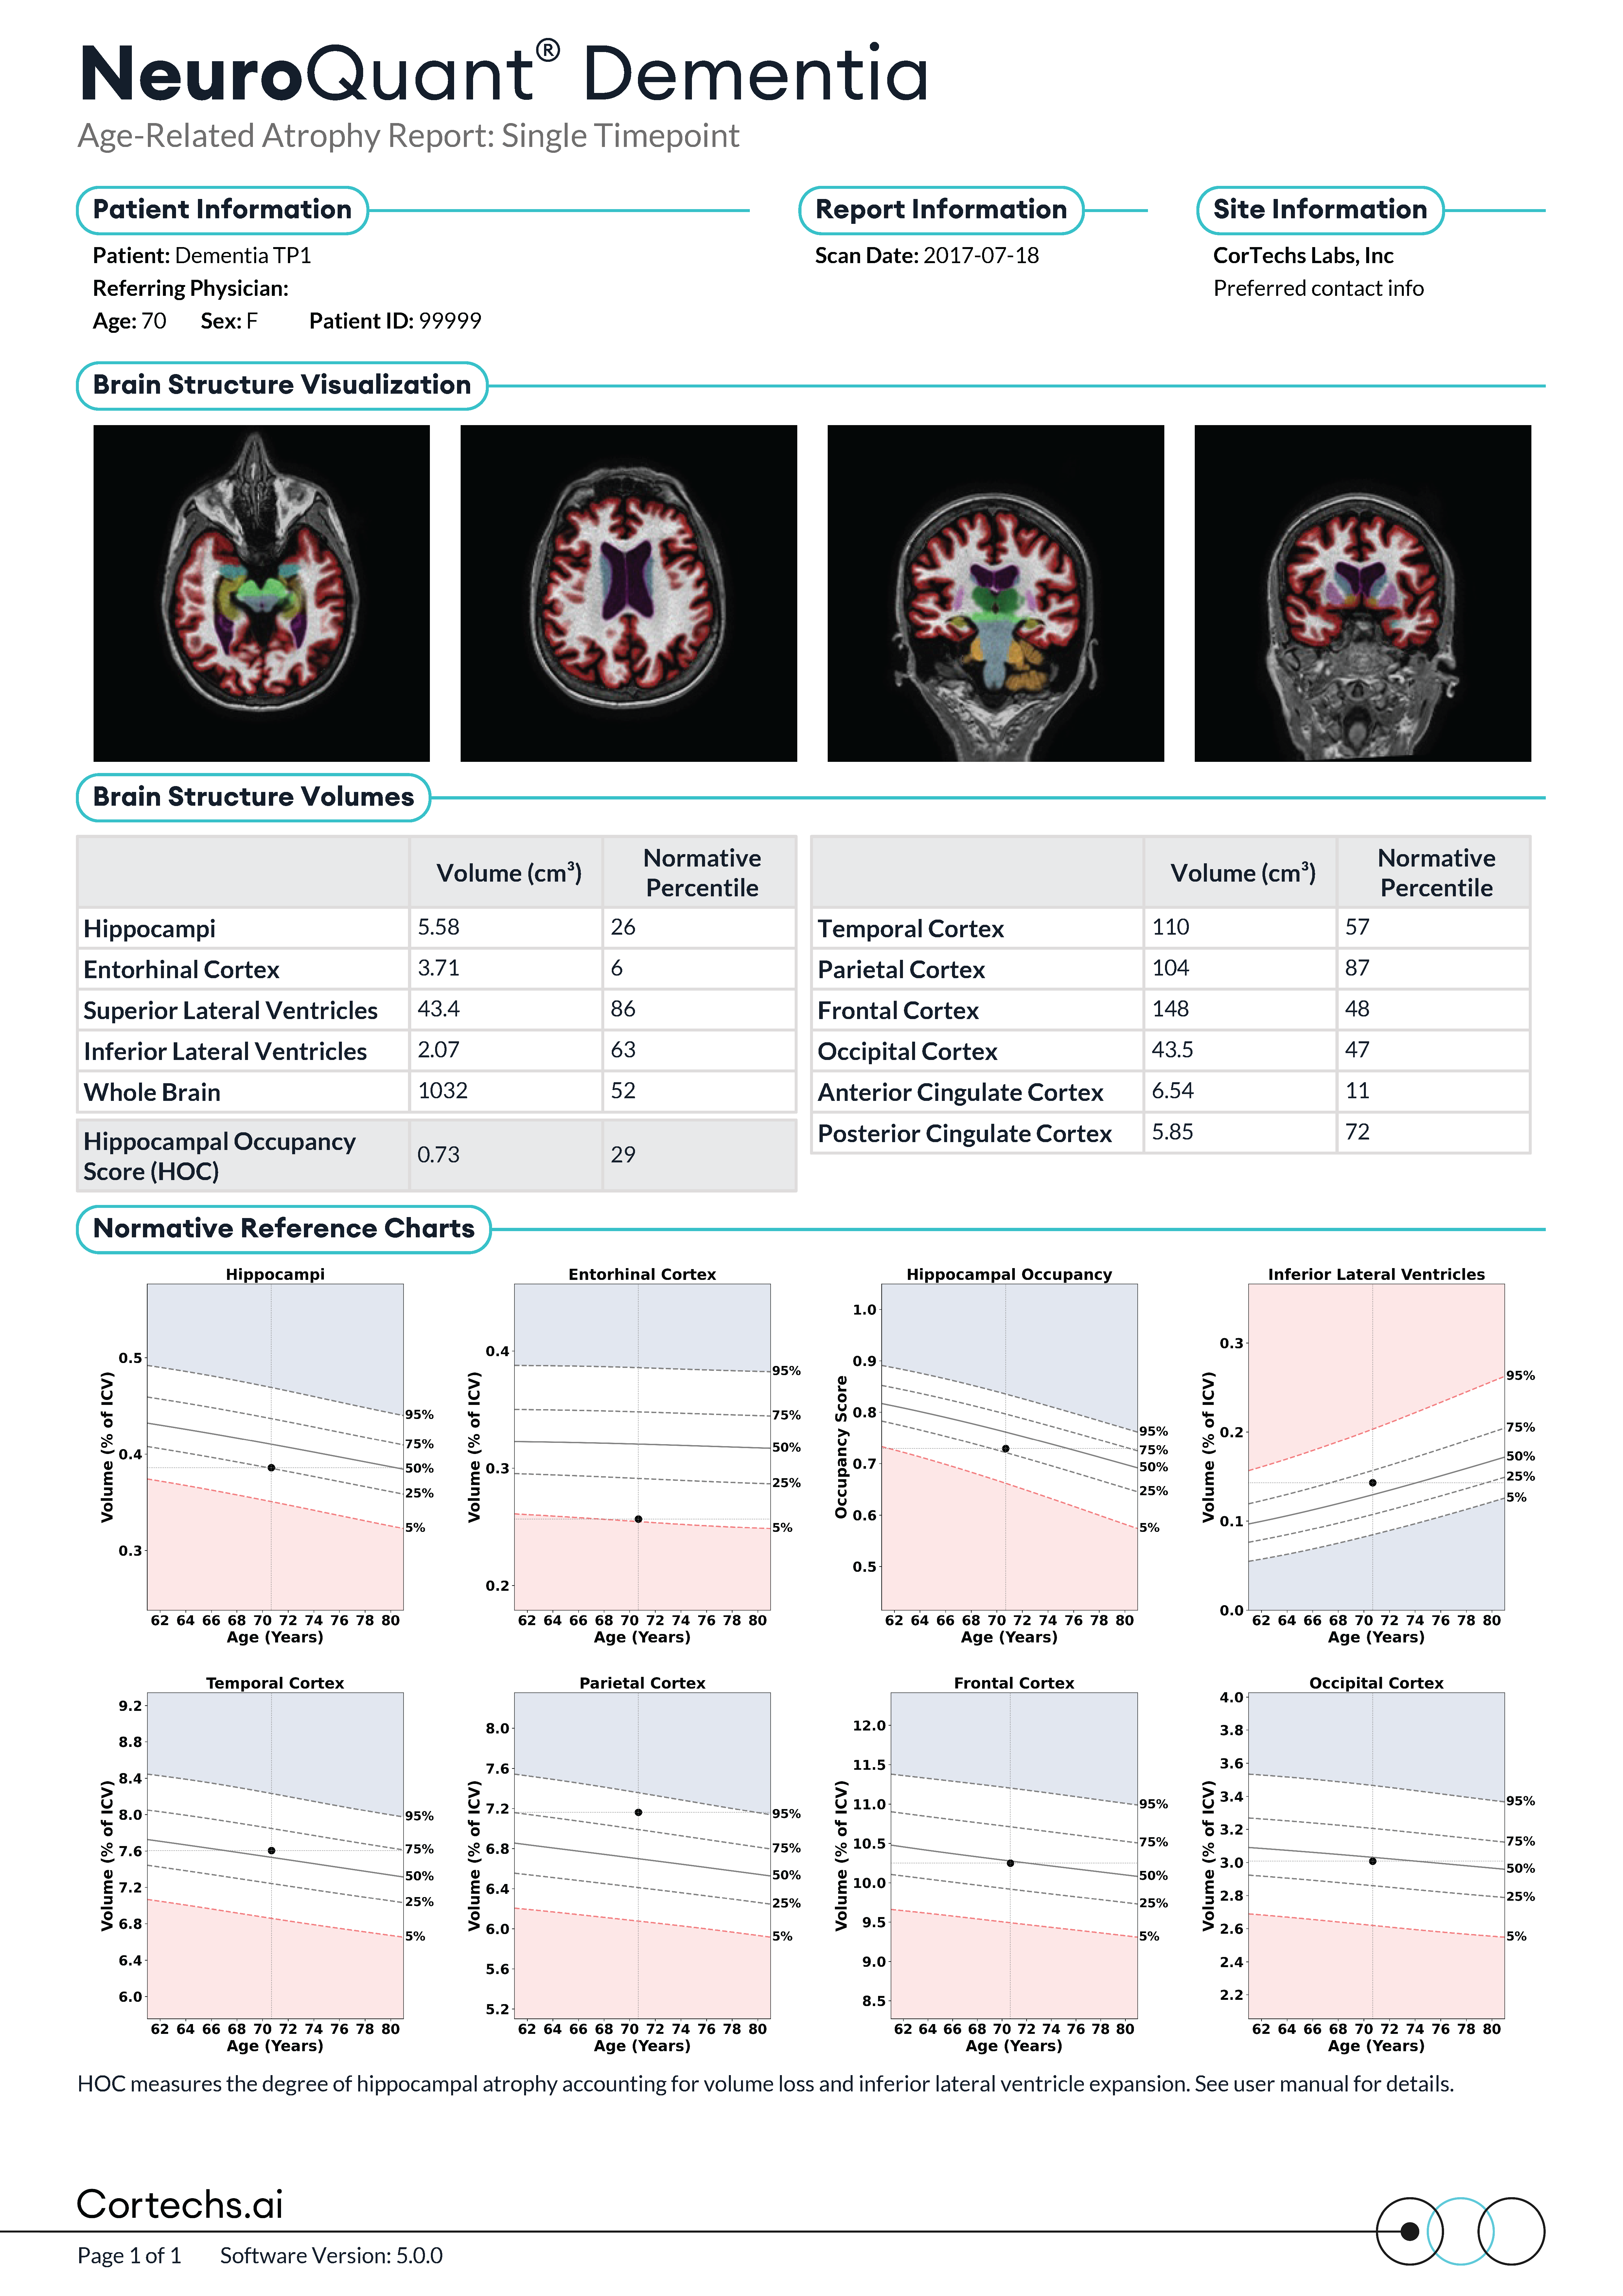
Dementia Report
Age-related Atrophy Report: For the assessment of dementia, Alzheimer’s disease and other neurodegenerative conditions. Quantifies neurodegeneration of the hippocampus and inferior lateral ventricles.
- Focuses on hippocampal and ventricular volumes, which are key regions in Alzheimer’s disease and other dementias.
- Provides Hippocampal Occupancy Score (HOC), a sensitive marker combining hippocampal atrophy with ventricular enlargement.
- Includes normative percentile comparisons across age/sex-matched populations to highlight deviations.
- Longitudinal charts allow visualization of progression when prior scans are available.
Microvascular Ischemic Disease
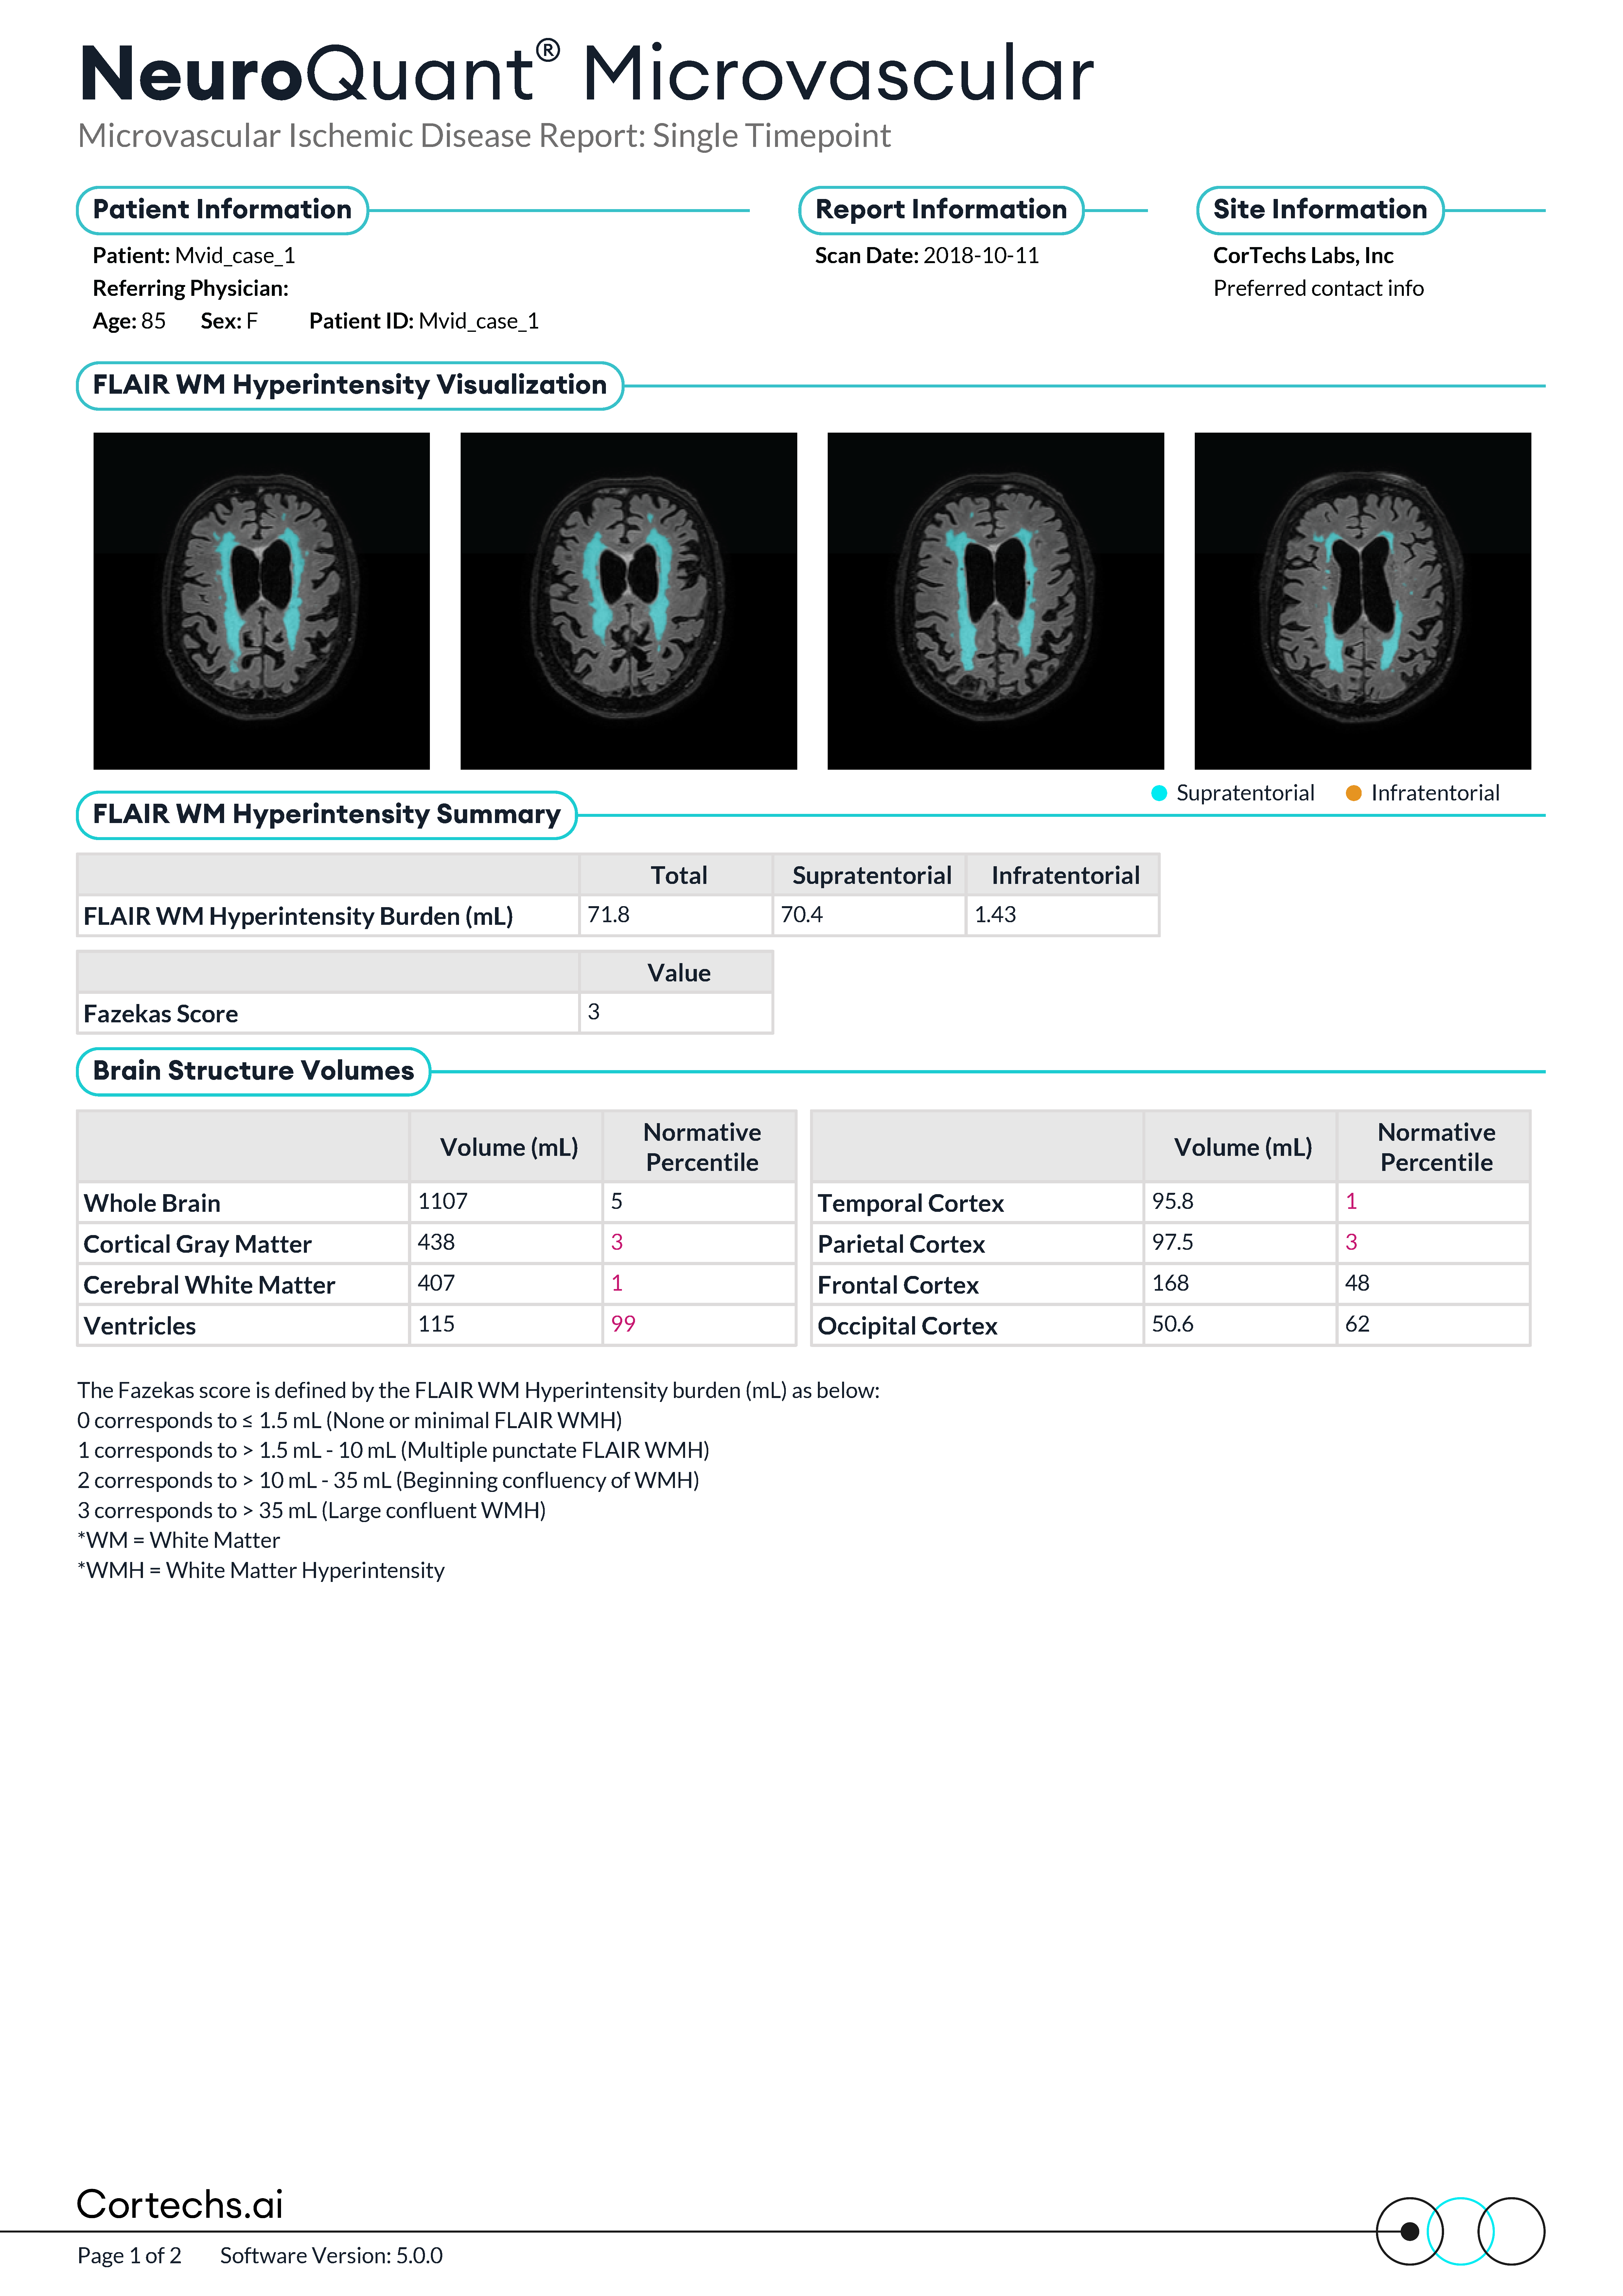
Microvascular Report
NeuroQuant Microvascular report segments and quantifies total hyperintensity volume burden and automates a Fazekas score.
- Quantifies white matter hyperintensities (WMH) by location and total burden using FLAIR.
- Provides autoamted Fazekas scoring (0–3) for standardized severity grading.
- Includes volumetric analysis of cortical gray matter, white matter, and ventricles.
- Useful for assessing vascular contributions to cognitive decline or vascular dementia.
Triage Brain Atrophy
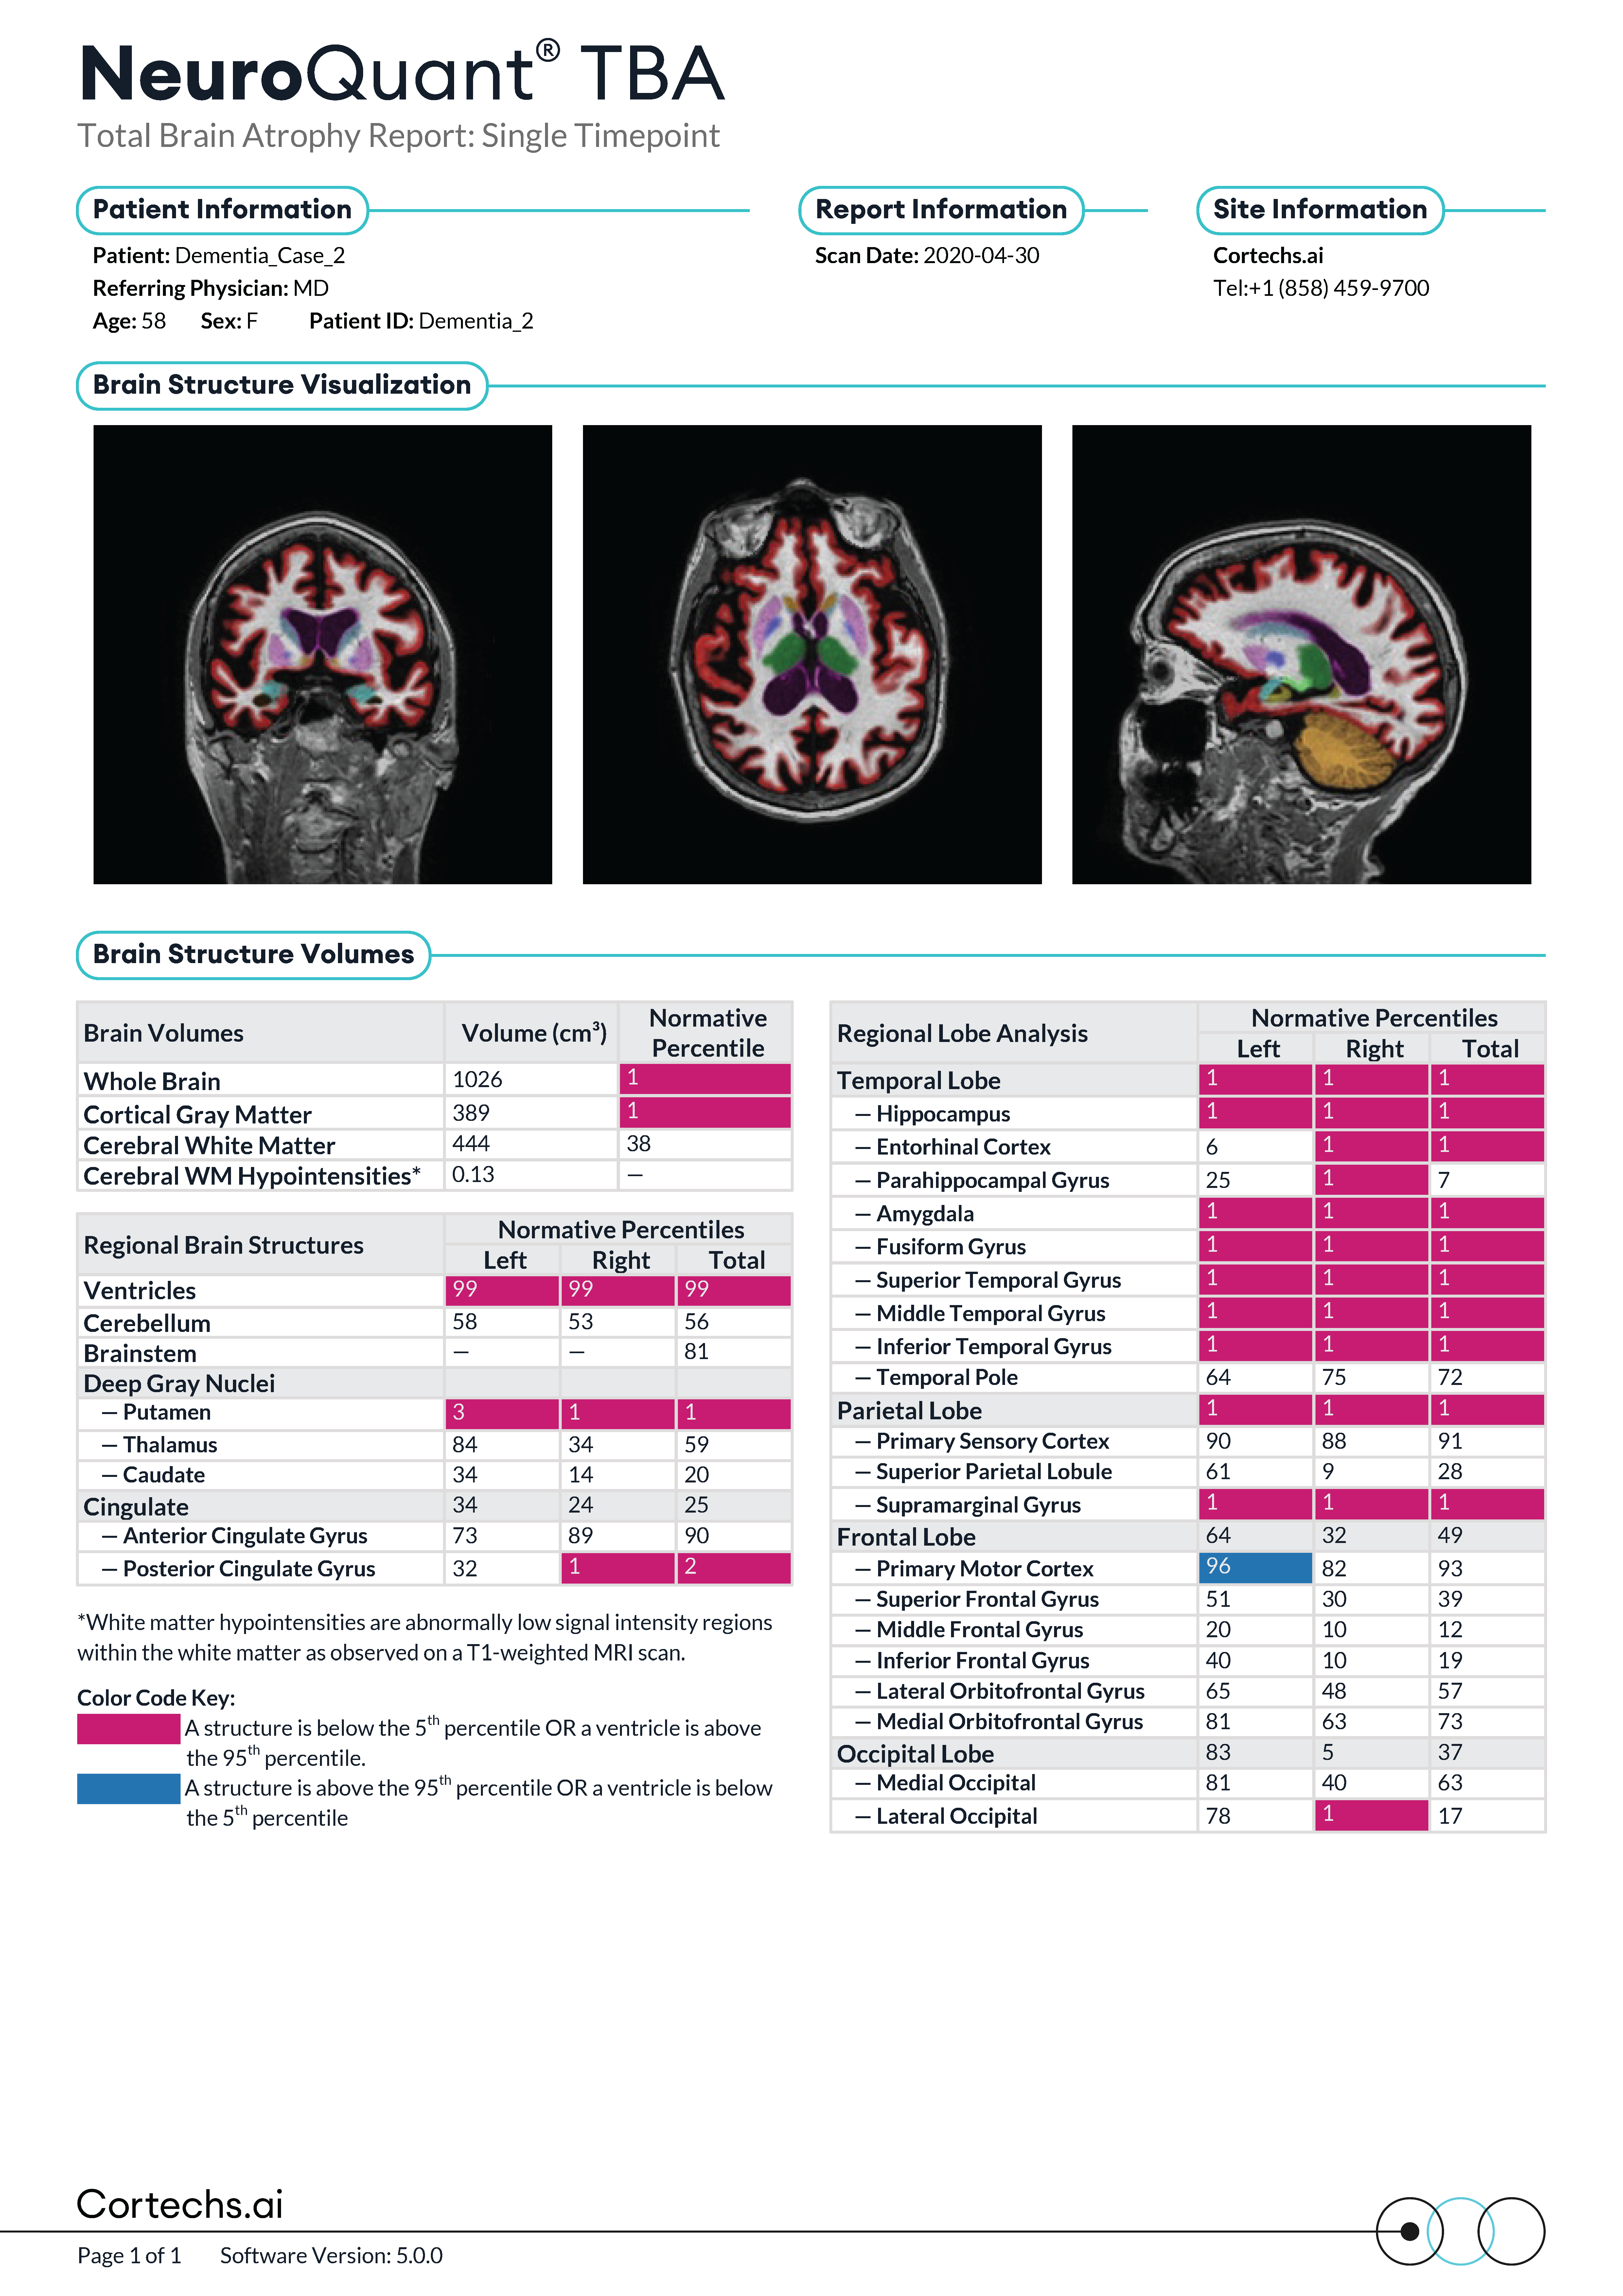
TBA Report
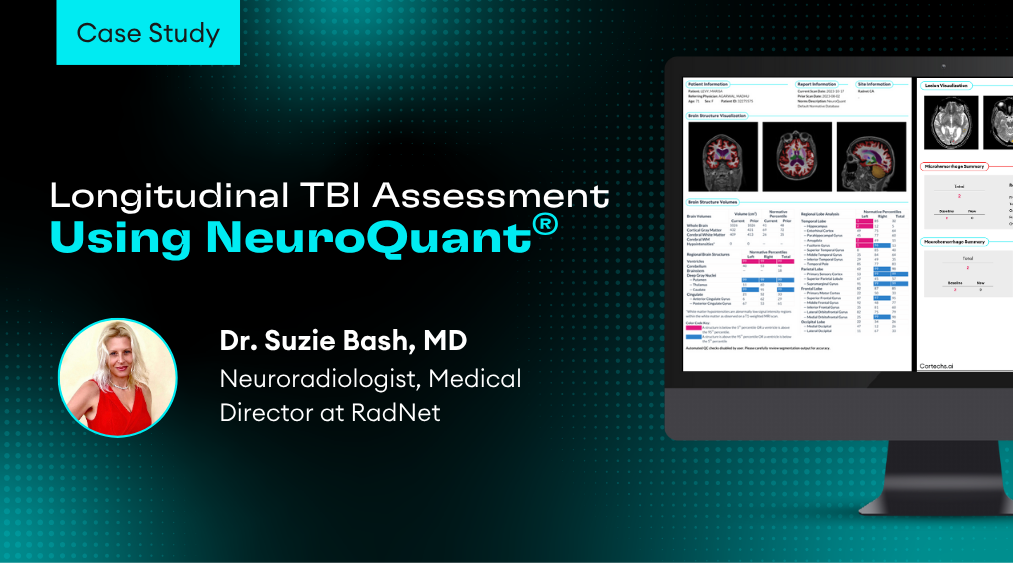
Triage Brain Atrophy Report for the assessment of traumatic brain injury and other neurodegenerative conditions. Shows 47 brain structures for both the right and left hemisphere, sorted by lobe and region.
- Screens 47 brain structures for atrophy patterns associated with trauma, PTSD, CTE, or diffuse axonal injury.
- Flags abnormalities with color-coded results outside normative percentiles.
- Incorporates lesion burden quantification when FLAIR images are included.
- Highlights regional vulnerabilities (e.g., hippocampus, amygdala) that may support assessment of cognitive or behavioral symptoms.
Multi-Structure Atrophy
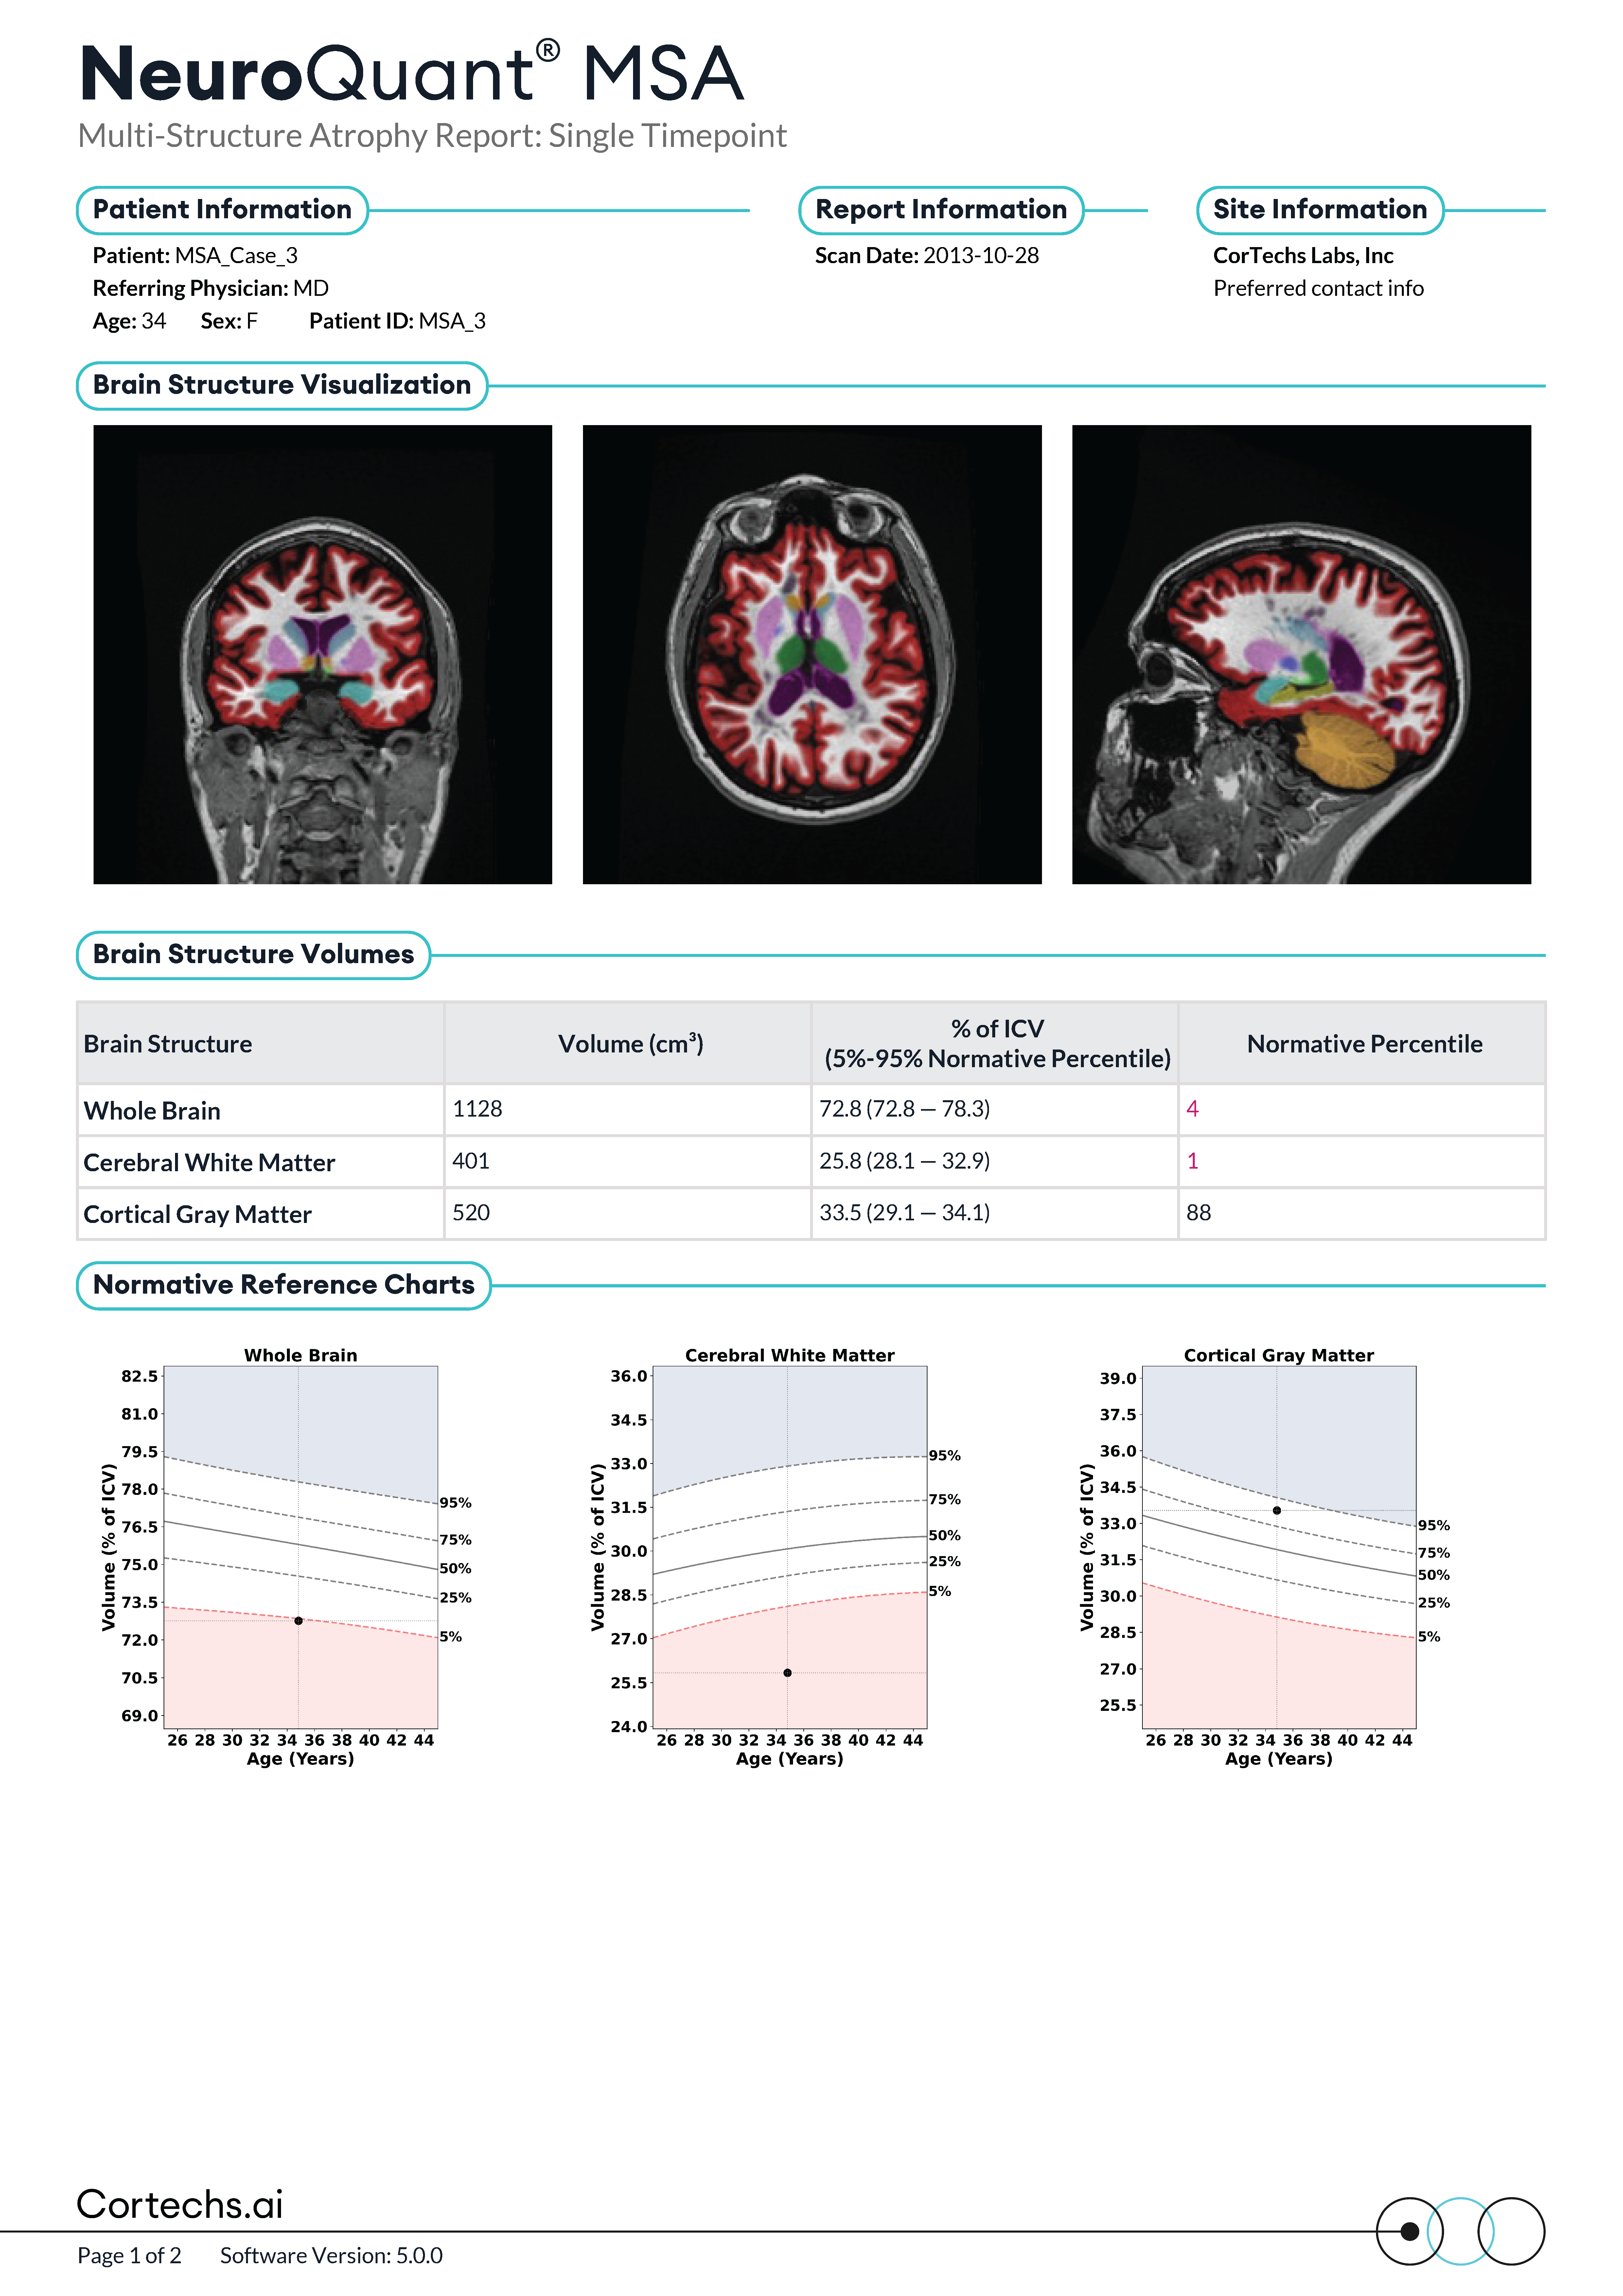
MSA Report
Multi-Structure Atrophy Report for the comprehensive assessment of brain volumes for age-associated neurodegenerative conditions. Supports physicians in their assessment of patients aged 3-100.
- Measures atrophy across multiple regions: hippocampi, thalami, cortical gray and white matter, and ventricles.
- Highlights early thalamic and hippocampal changes, relevant in multiple sclerosis and other neurodegenerative conditions.
- Provides clear visualization of brain atrophy vs. ventricular enlargement patterns.
- Supports clinicians in differentiating diffuse brain atrophy from localized structural changes.
Hippocampal Asymmetry
Seizure Report
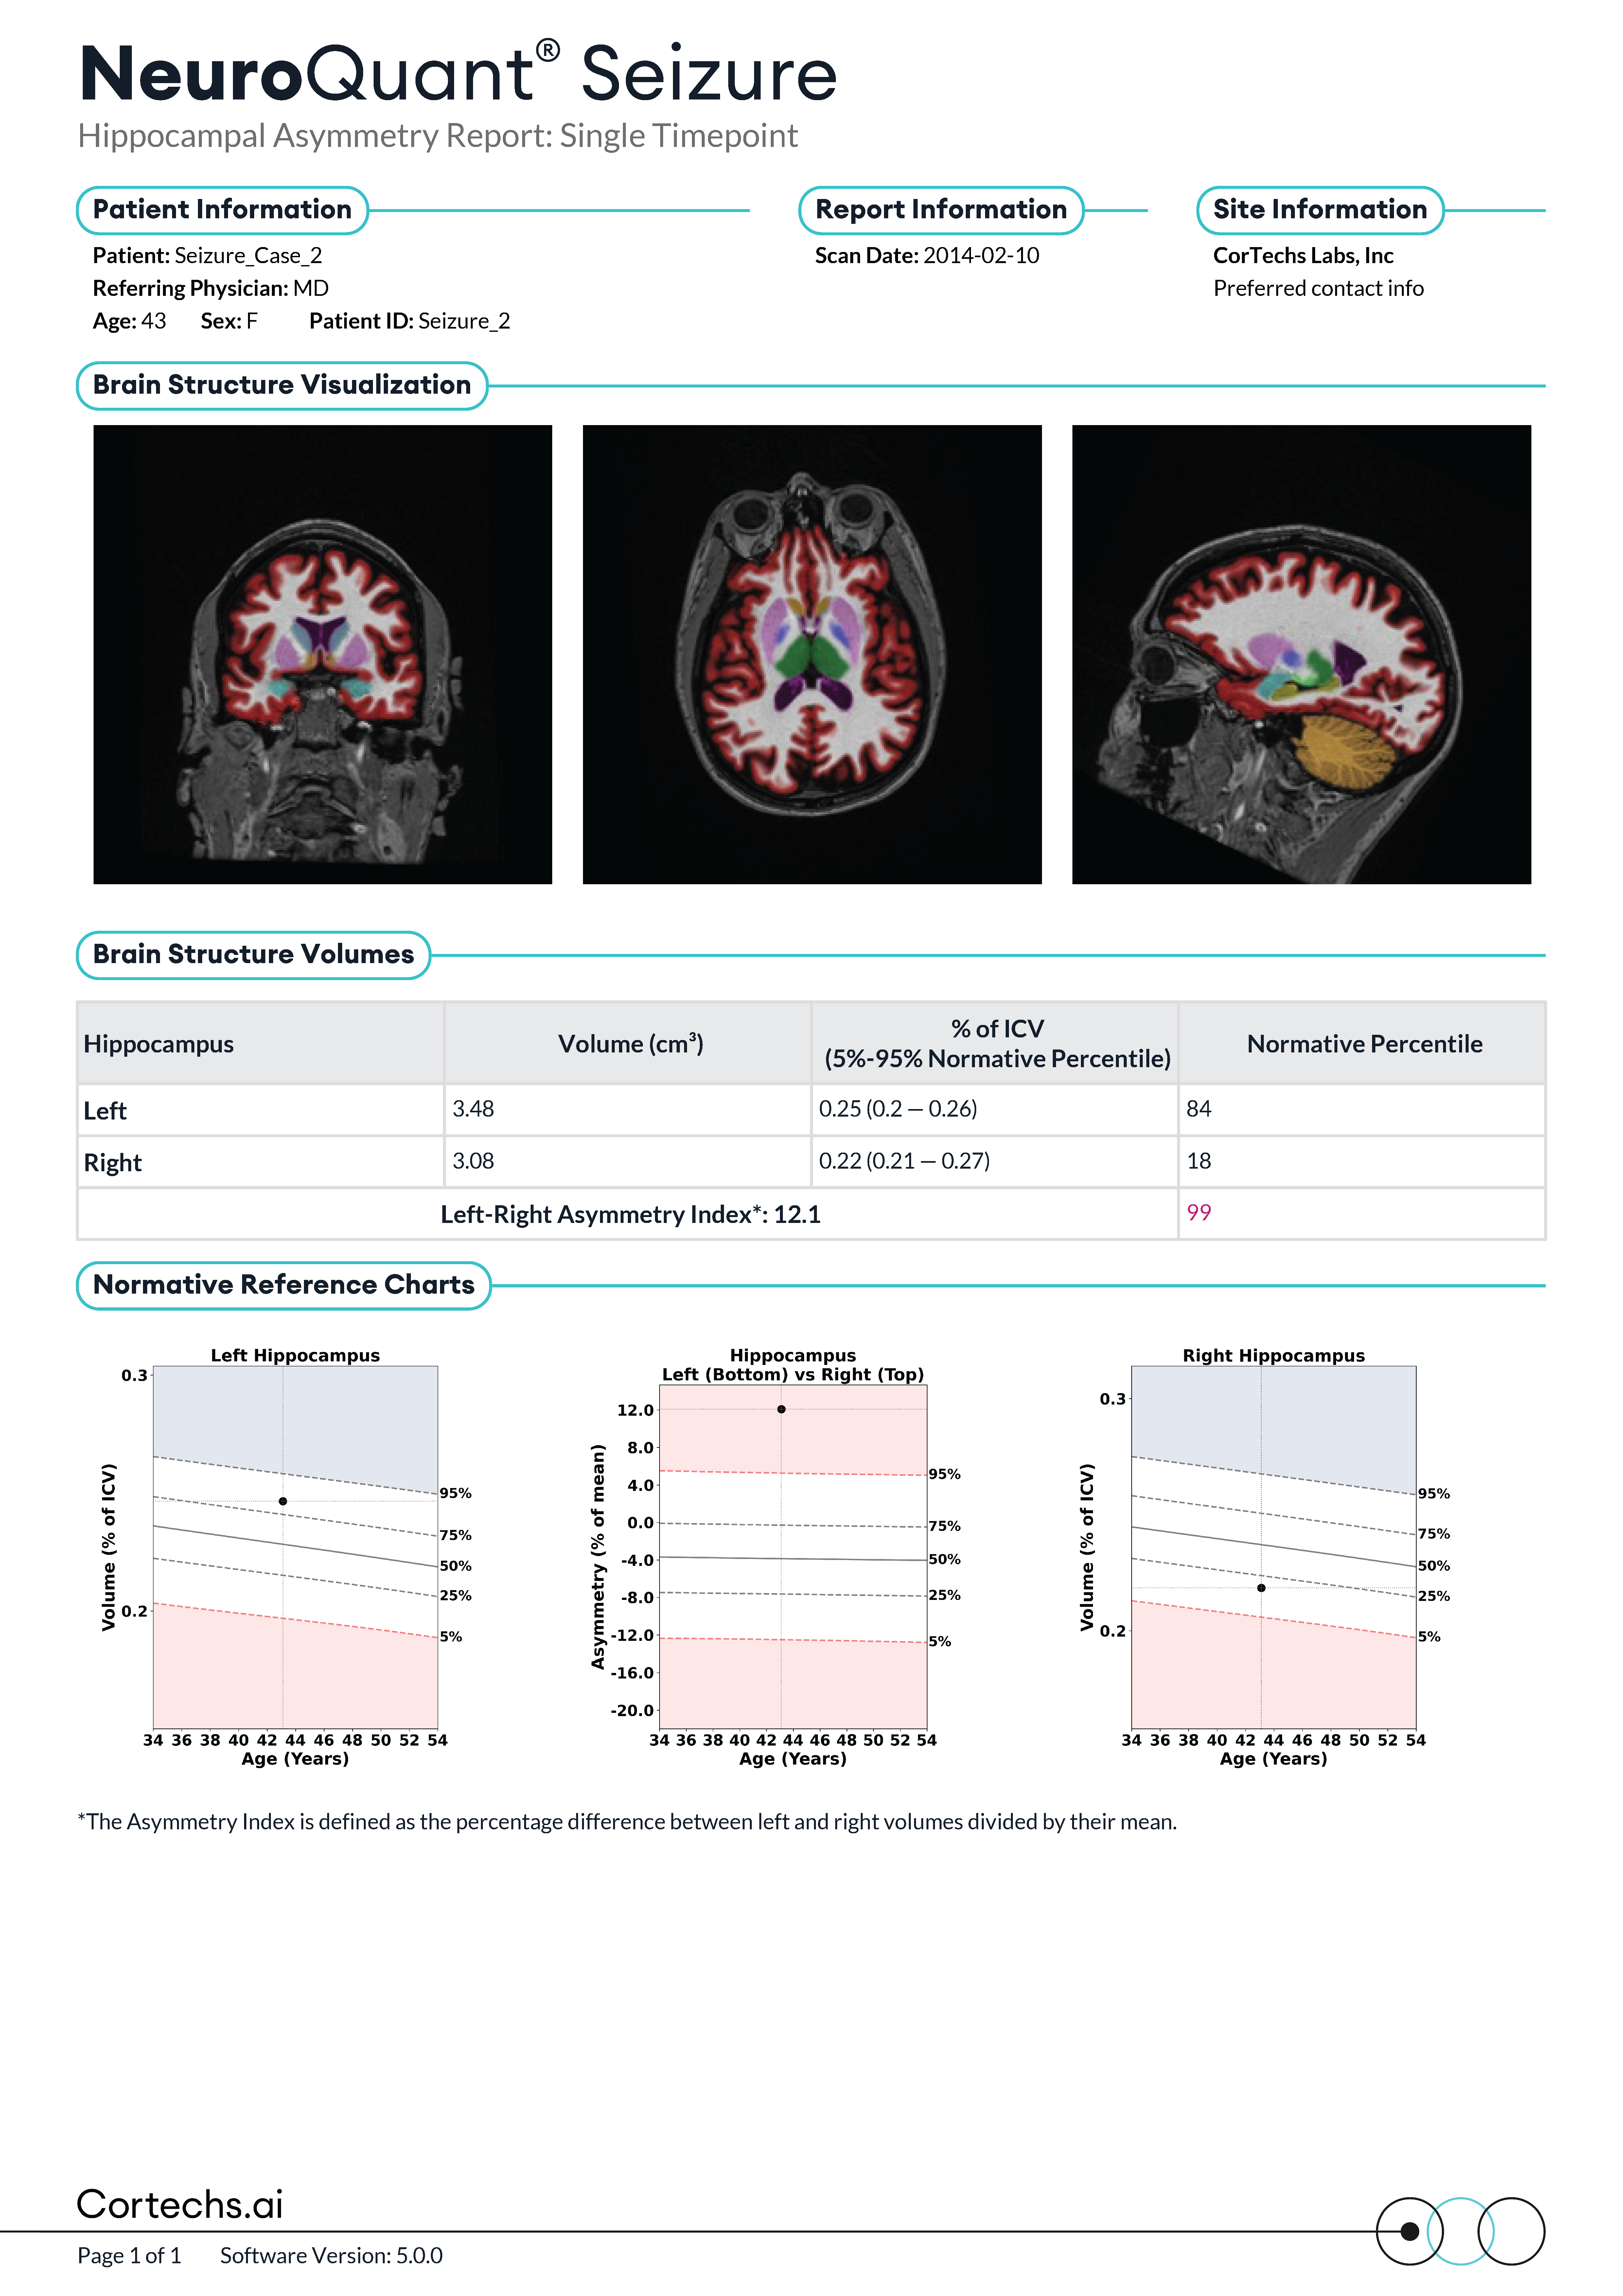
Hippocampal Asymmetry Report for the assessment of temporal lobe epilepsy and unilateral degenerative conditions. Presents absolute and relative volumes for identification of asymmetry between hippocampi.
- Quantifies left vs. right hippocampal volumes to detect asymmetry common in temporal lobe epilepsy.
- Provides an Asymmetry Index benchmarked against a normative database.
- Visual and quantitative results help confirm suspected hippocampal sclerosis or mesial temporal sclerosis.
- Supports surgical planning and treatment monitoring in epilepsy patients.
Brain Development
Pediatrics Report
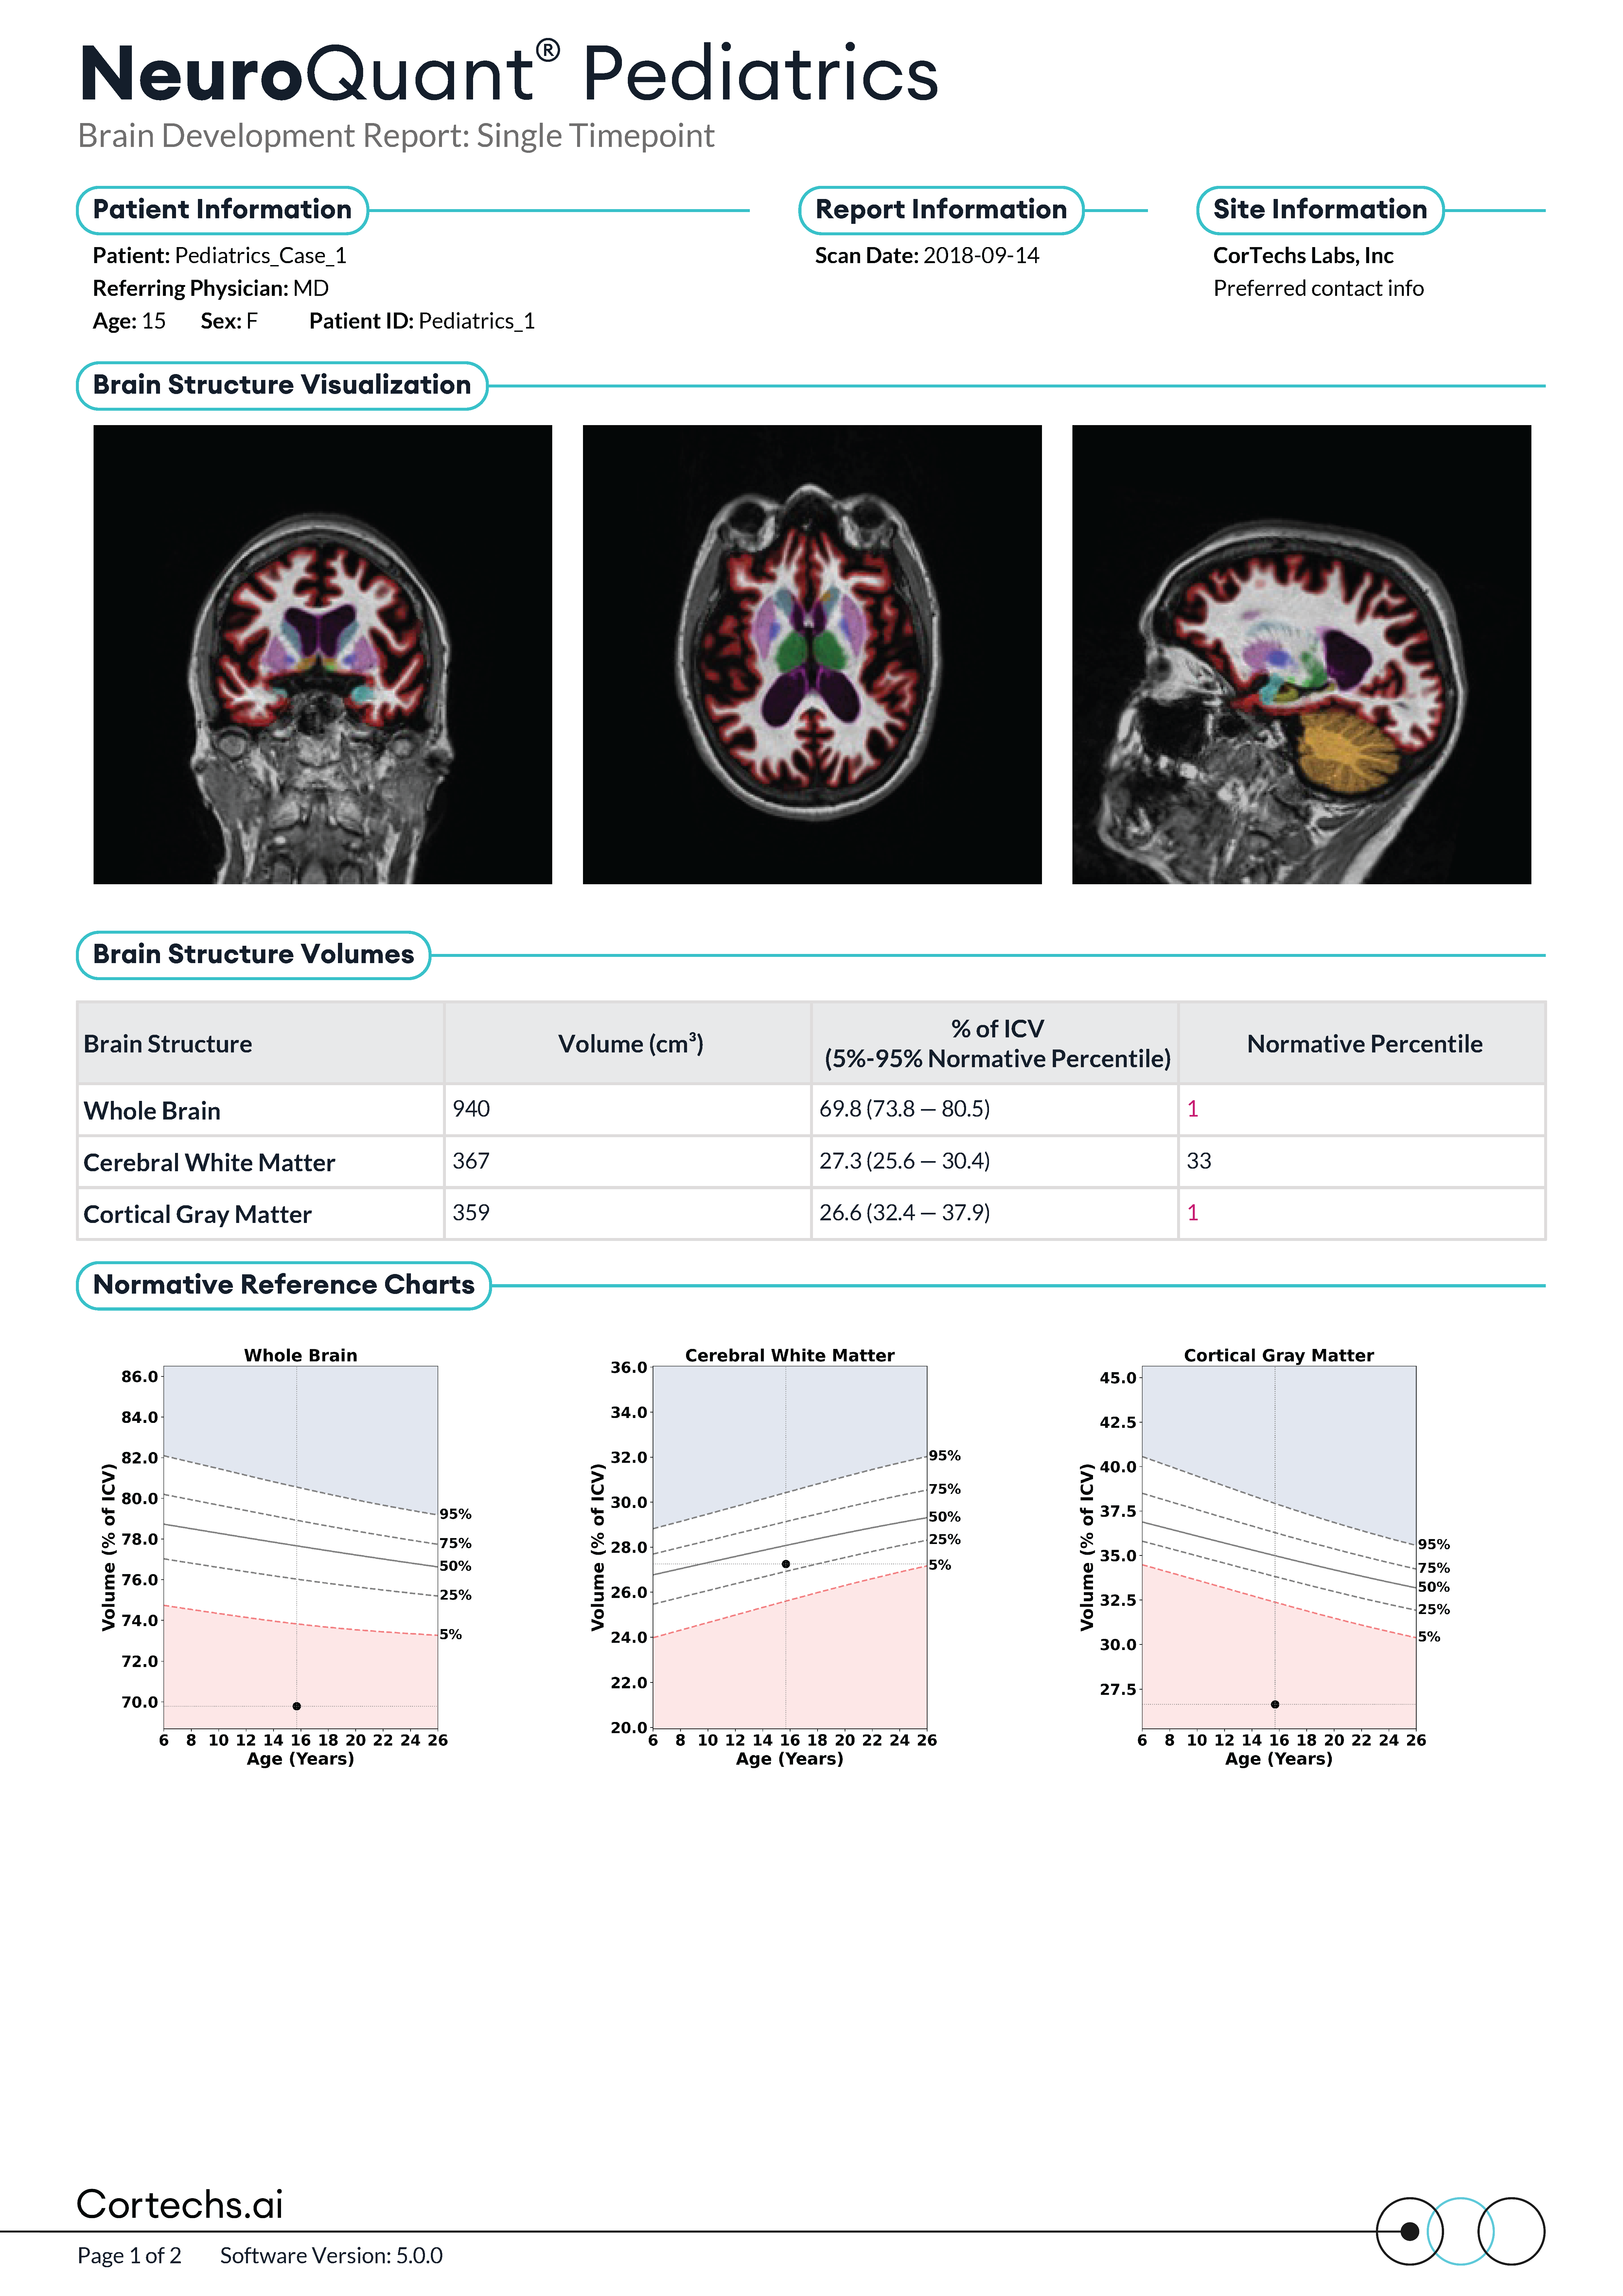
Brain Development Report for the assessment of brain volumes for patients three years and older.
- Measures volumes of cortical gray matter, white matter, cerebellum, and ventricles to assess development.
- Compares patient data to age-matched growth curves, helping identify delays or abnormal brain maturation.
- Detects compensatory changes such as ventricular enlargement when cortical volumes are reduced.
- Can be useful in conditions like leukodystrophies, autism, and cerebral palsy where structural development varies.
Custom Brain Region
Custom Volumetric Report
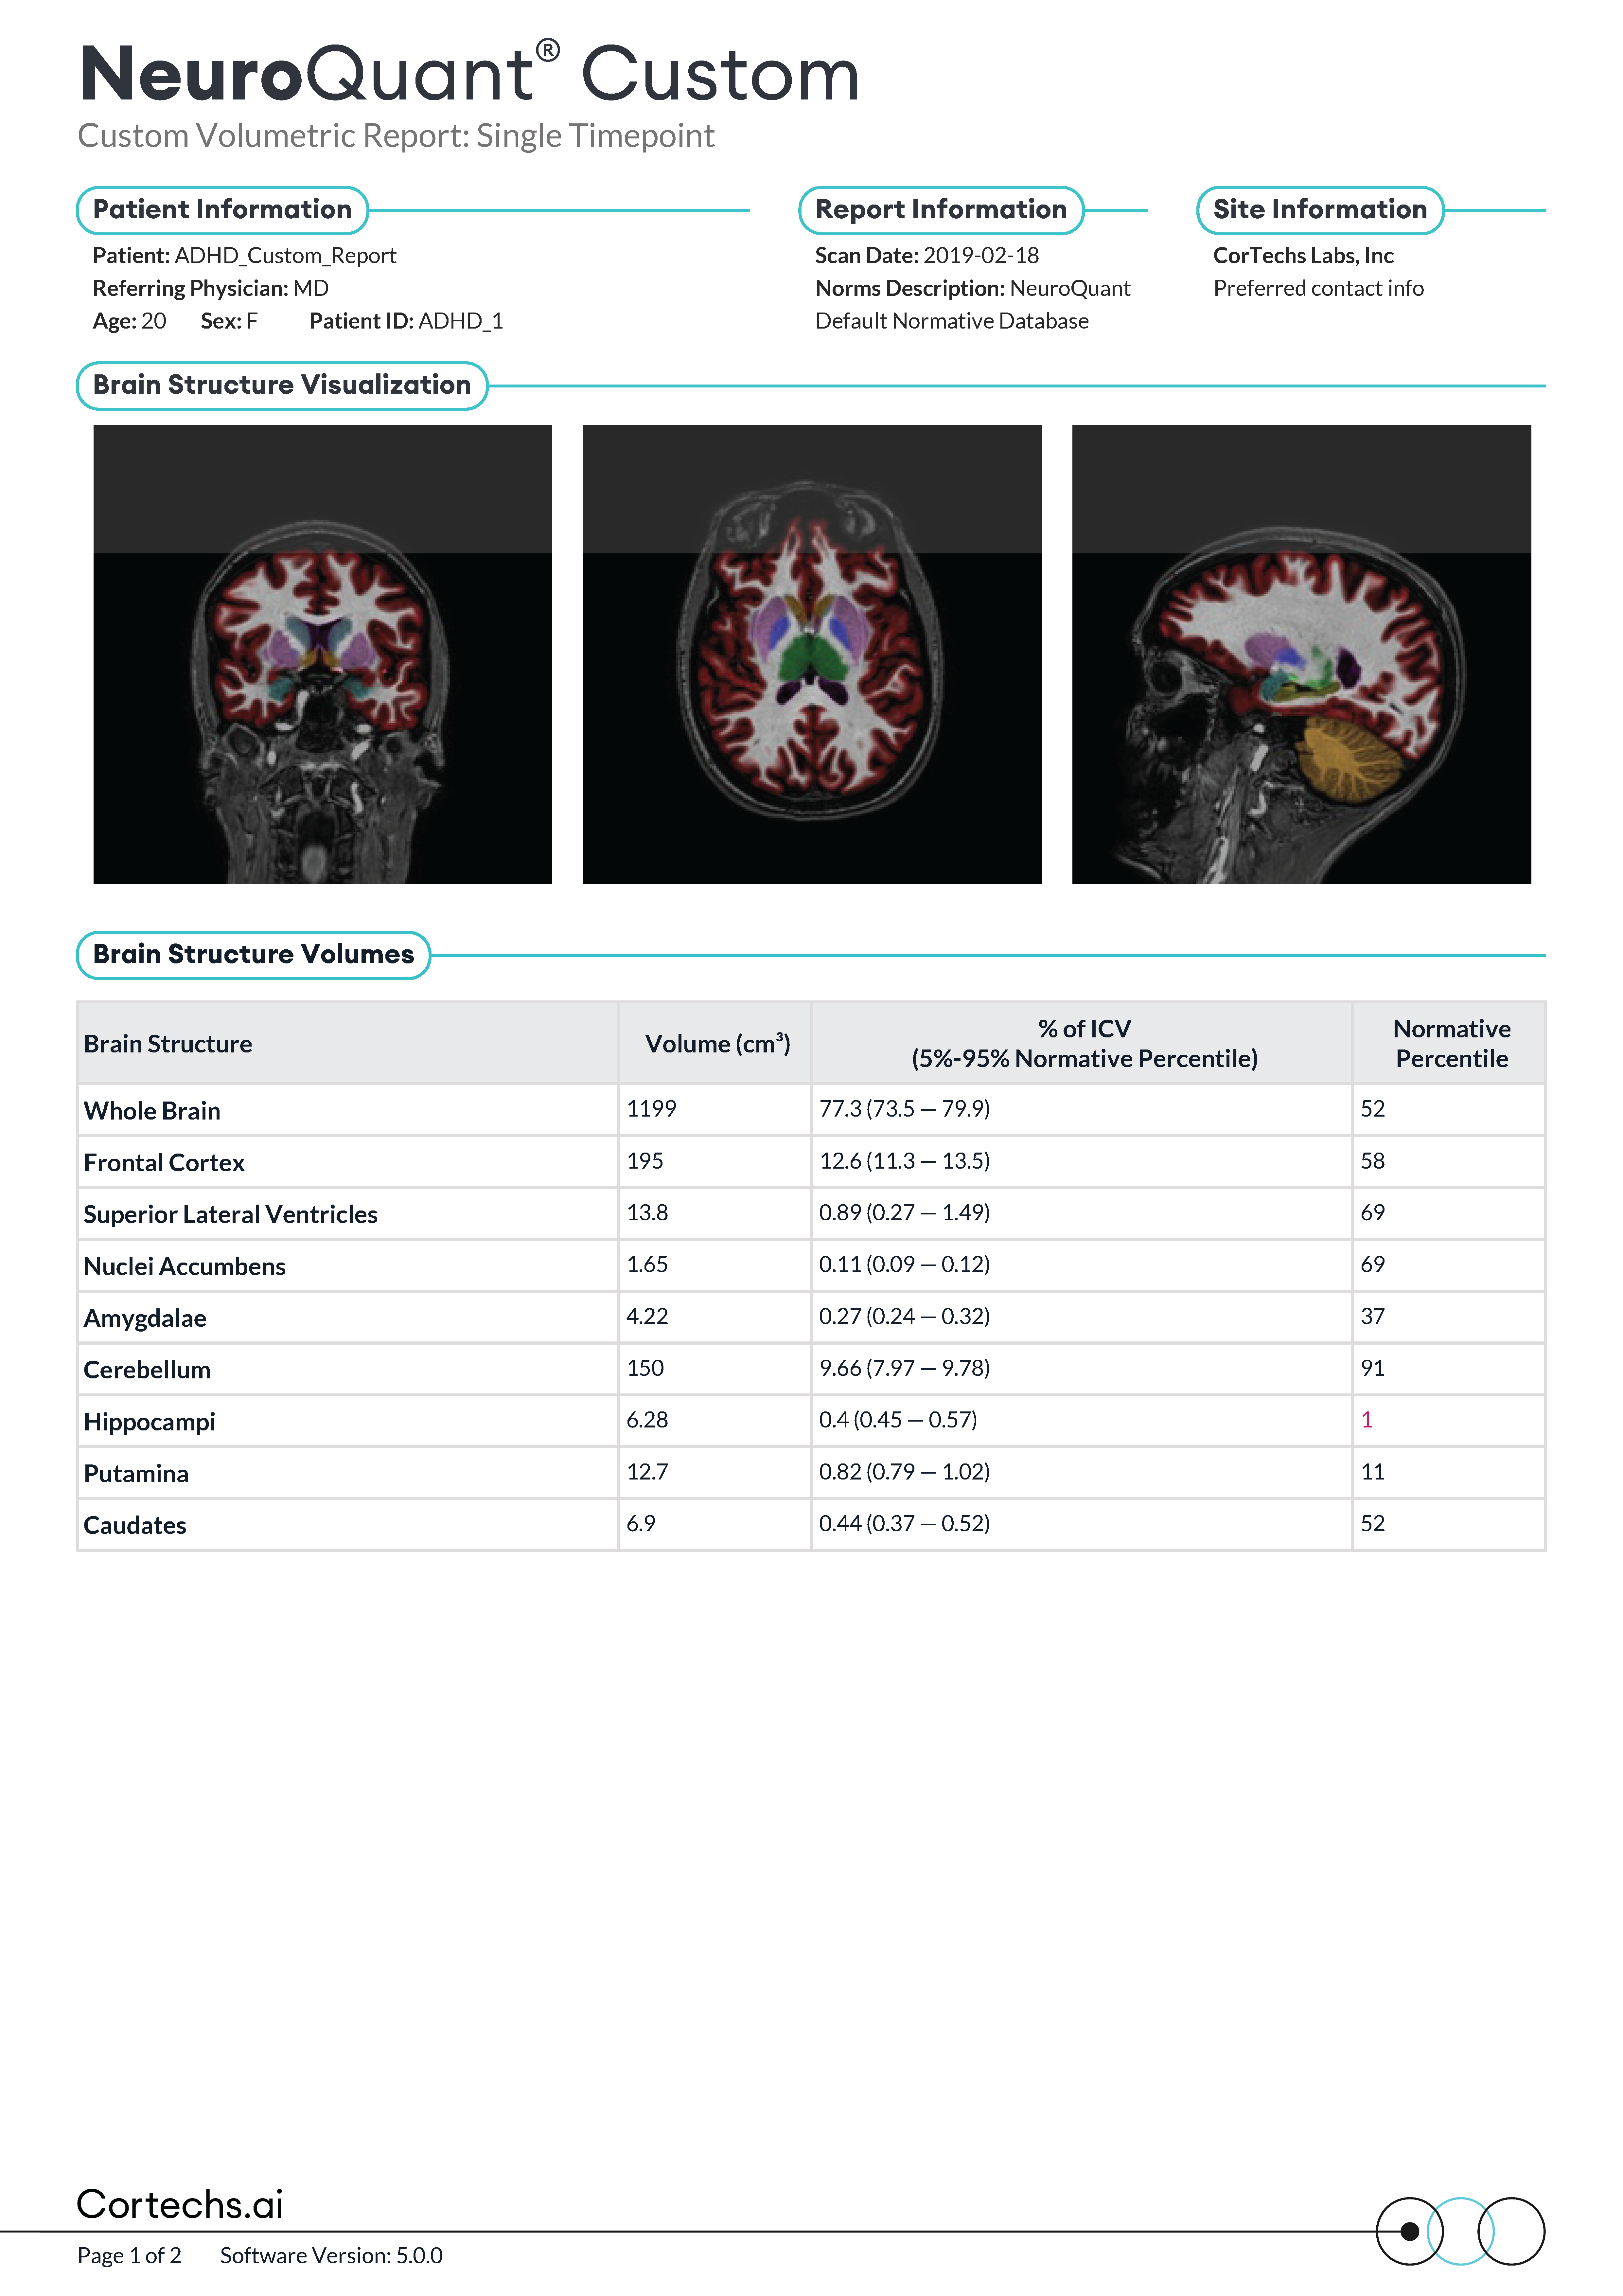
Customizable volumetrics report for the assessment of neurodegenerative conditions. Allows physicians to individually tailor NeuroQuant® volumetrics to their clinical cases.
- Flexible design: select up to 9 brain structures most relevant to the clinical question.
- Reports left, right, total, and asymmetry indices for chosen structures.
- Normative comparison allows objective interpretation across conditions like ADHD or Huntington’s disease.
- Provides a tailored analysis that adapts to specific physician or research needs.
General Morphometry Analysis
Morphometry Report
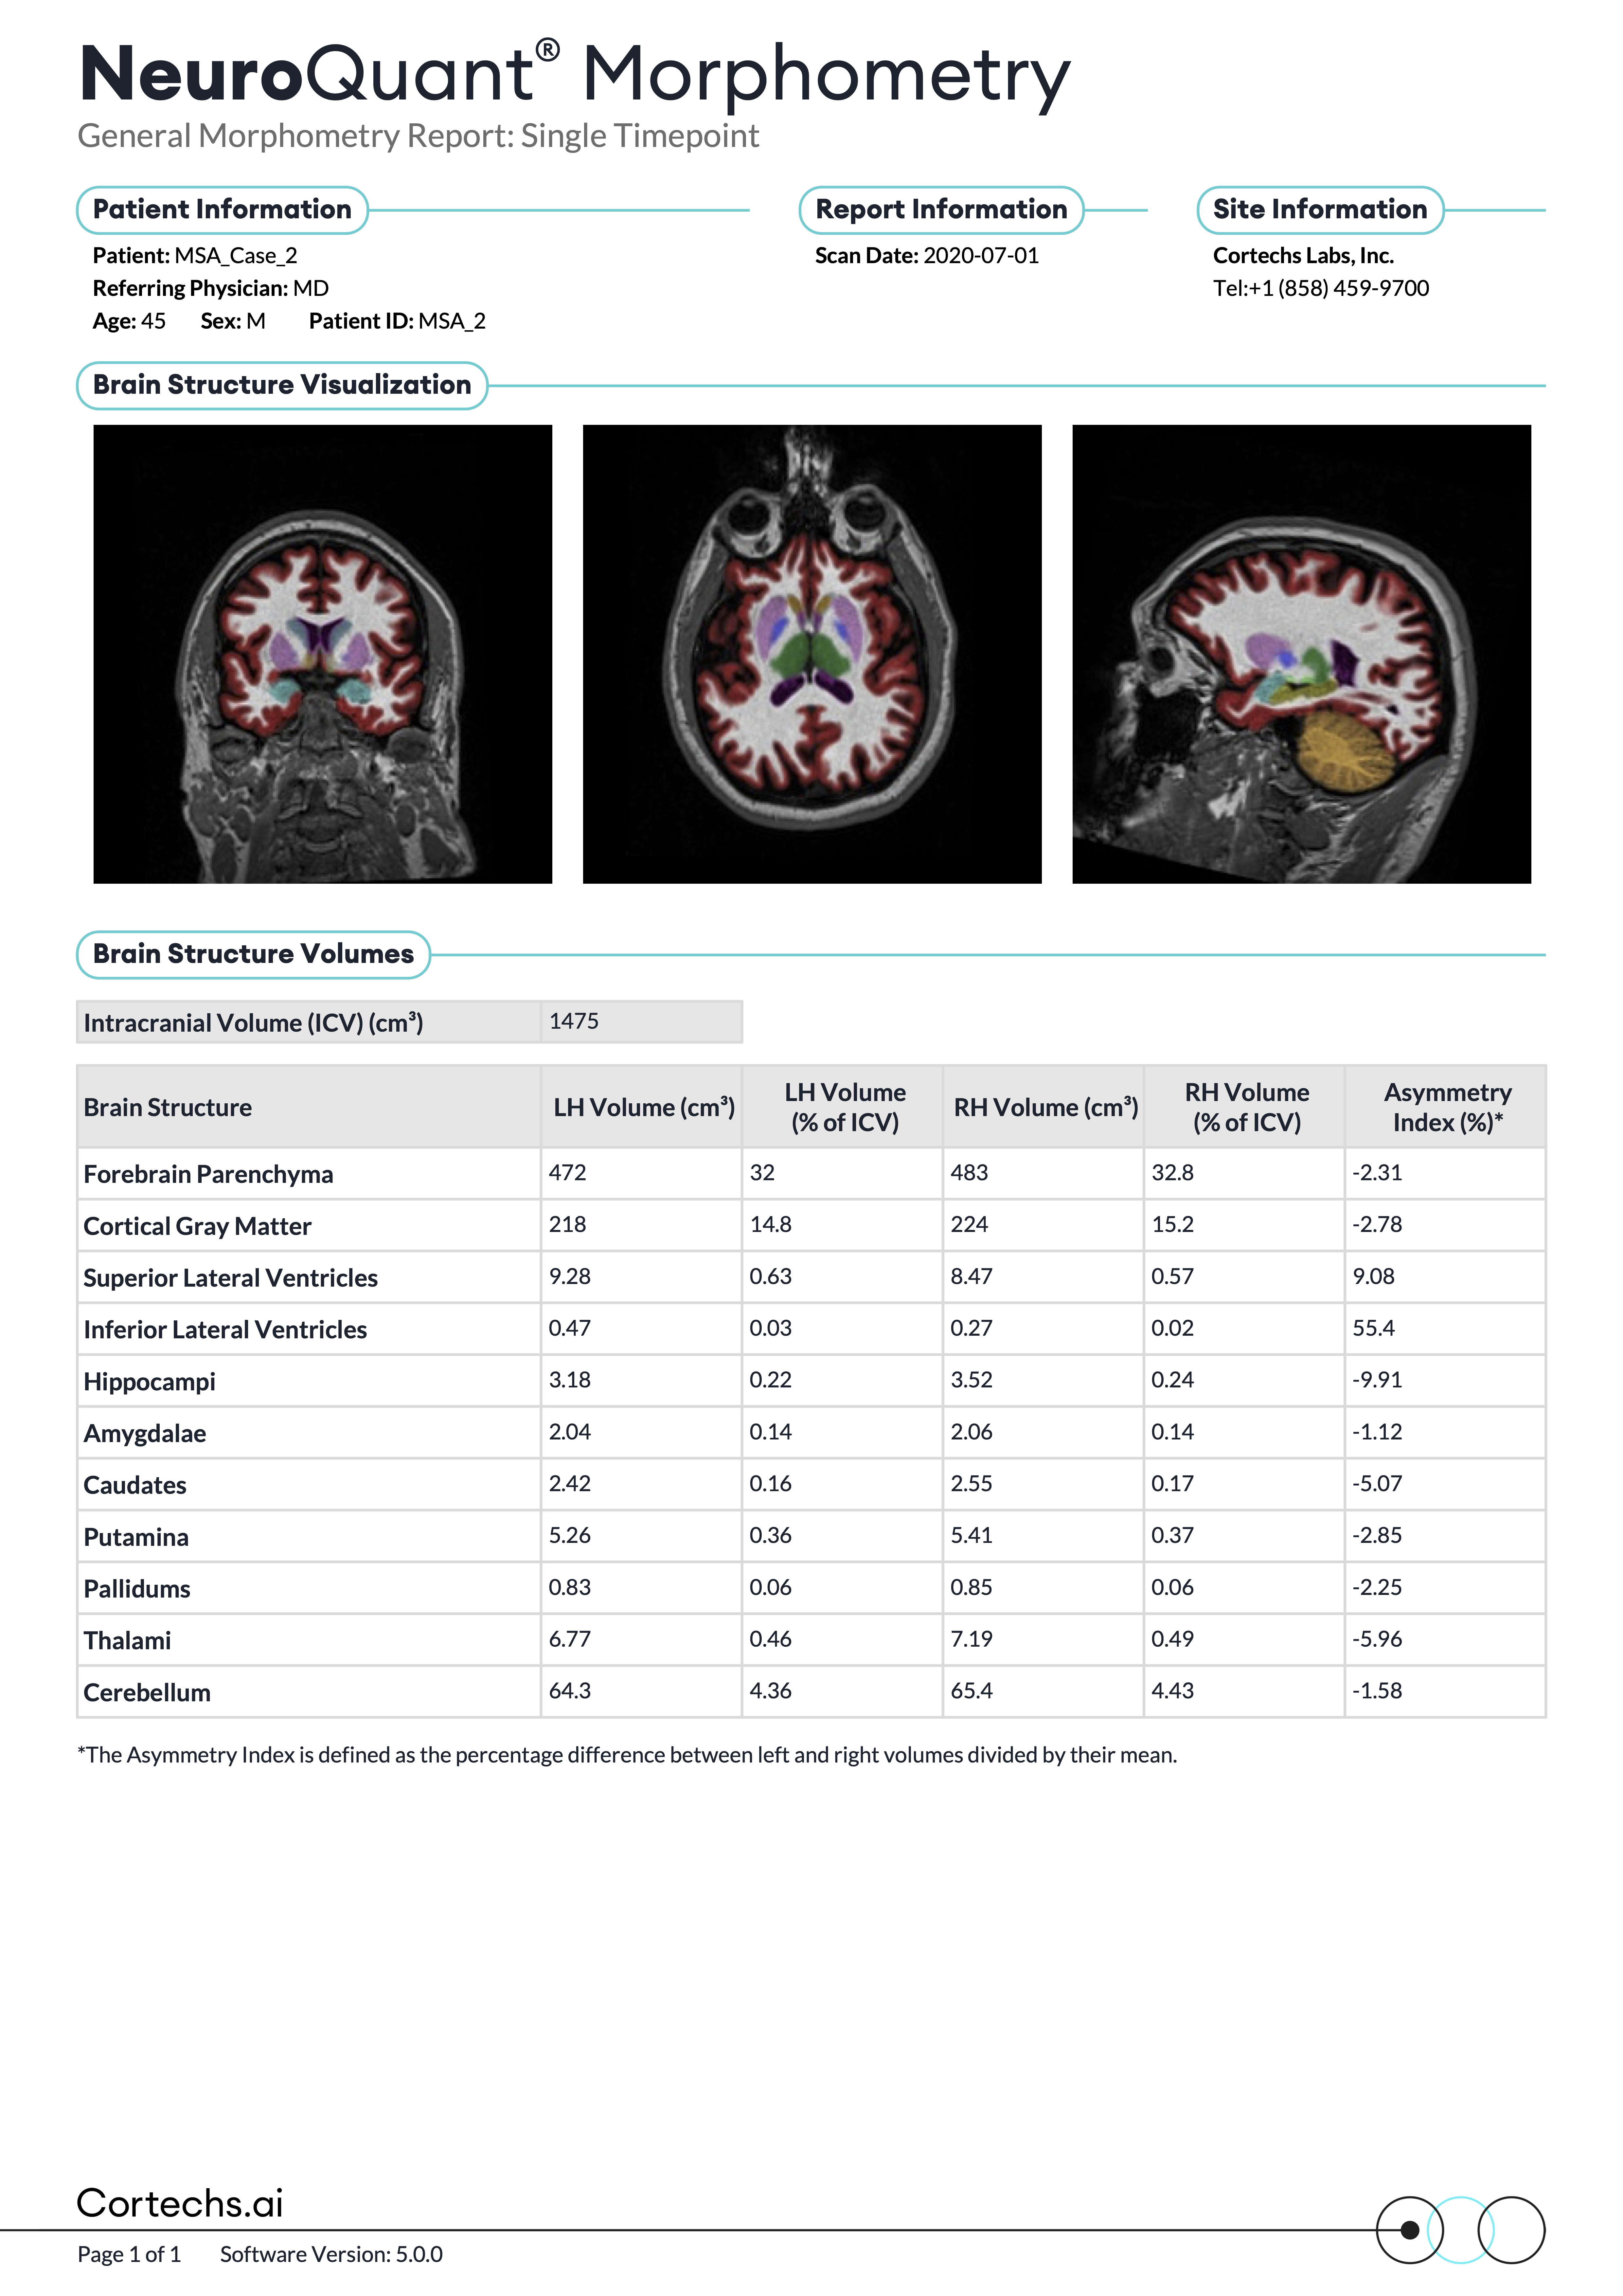
General Morphometry Atrophy Report provides supplemental quantitative brain volume information for the assessment of neurological conditions not covered by other reports.
- Provides a broad overview of 11 cortical and subcortical structures.
- Reports asymmetry indices to highlight left/right imbalances.
- Can be included alongside all other NeuroQuant reports as a reference baseline.
- Helps contextualize findings in condition-specific reports.
Benefits
Change visualization
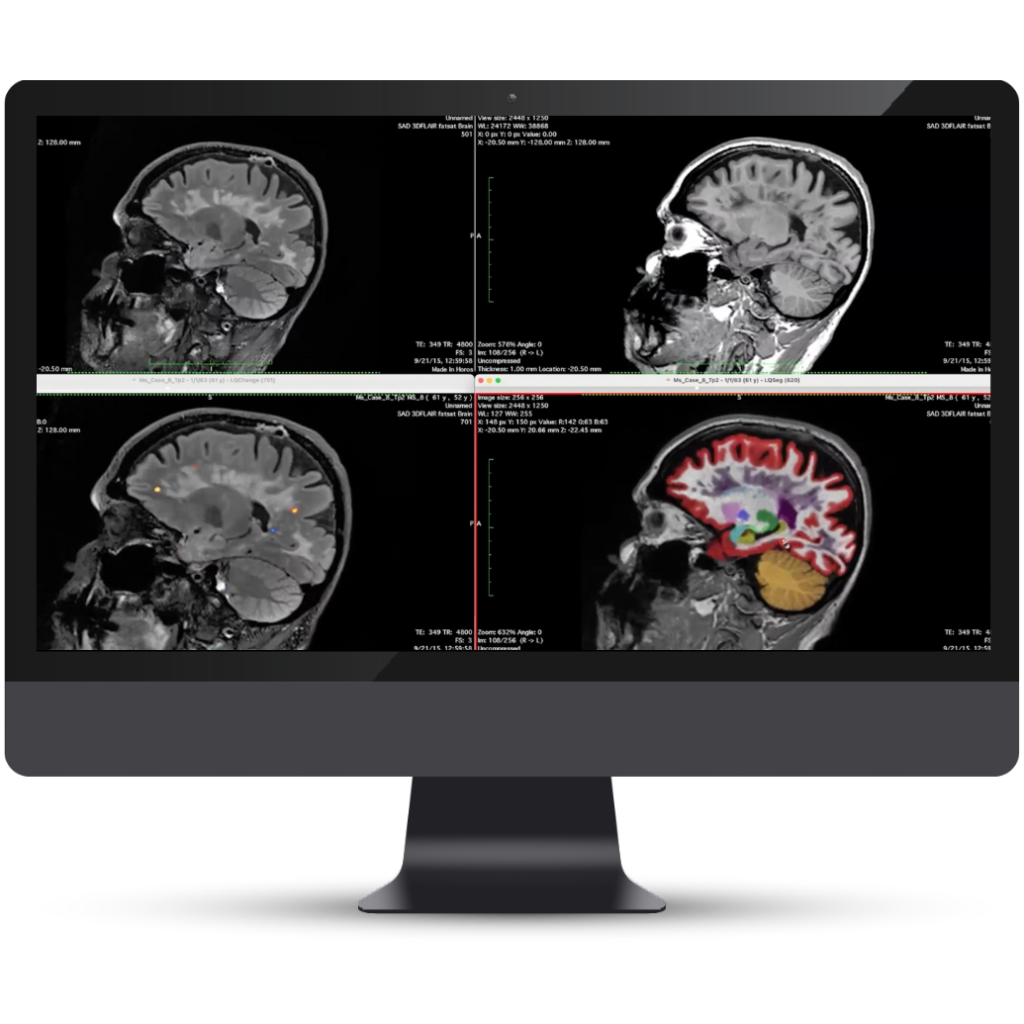
Use high-resolution 3D T1 images to detect subtle changes in ventricle expansion, tissue atrophy, and swelling.
Longitudinal disease tracking
Monitor structure volumes and visually evaluate changes using color-coded overlays and change quantification data.
Normative reference data
Compare the patient’s brain structure volume measurements to a normal population.
Accuracy across all ages
Analyze ages 3-100 using our Dynamic Atlas™ technology, validated over thousands of clinical cases.
Adaptable data outputs
Tailor solutions for a broad spectrum of neurological disorders, including MS, Alzheimer’s Disease, epilepsy, microvascular ischemic disease, TBI, and ARIA.

Understanding CPT Codes 0865T & 0866T
As of January 1, 2024, new Category III CPT codes (0865T, 0866T) are active for AI-assisted quantitative brain MRI analysis. These codes apply to a variety of vendor solutions, including Cortechs.ai, and serve as an essential step toward achieving permanent reimbursement.
