We’re excited to announce an update to NeuroQuant MS: a simplified and more intuitive method for analyzing lesion dynamics across multiple timepoints. With the release of version 5.0, this enhancement provides clearer insights into lesion changes, aiding in the understanding of disease progression.
The Updated NeuroQuant MS Lesion Dynamics
The NeuroQuant FLAIR module, a cornerstone of our MS solution, processes 3D T1 and T2 FLAIR images to provide information on brain lesions characterized by hyperintensities in the T2 FLAIR images using a static deep-learning model.
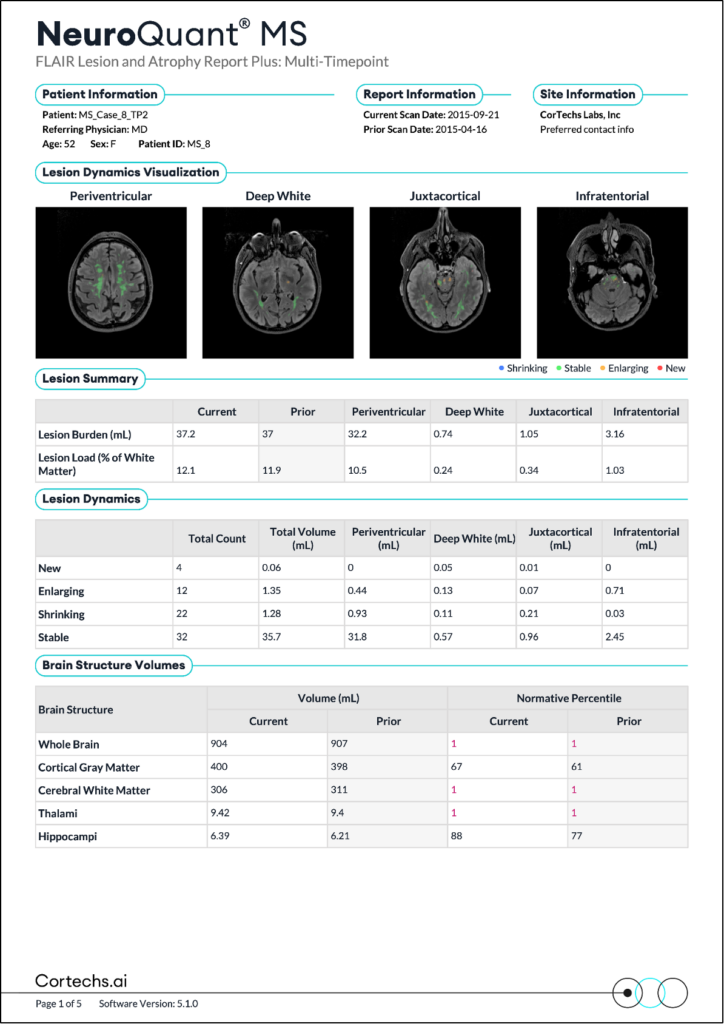
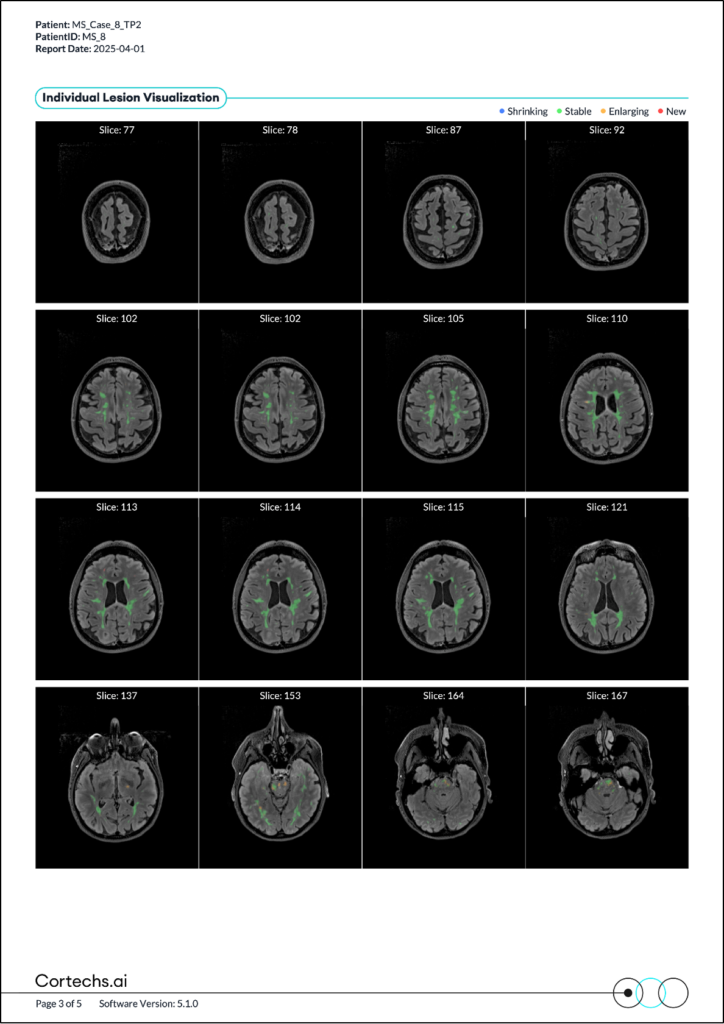
If earlier scans for the patient have been processed on the system, the output will now include a new series that visualizes color-coded changes in lesions over time. The updated algorithm, released in version 5.0, simplifies the way lesion dynamics are computed across two timepoints. By using segmentation masks from both the current and prior studies, the system now calculates and visualizes lesion changes, offering more intuitive data with clearer labeling and improved visualization of affected areas.
Breaking Down the Lesion Dynamics Report
The DICOM output visualizes areas of change and aligns with the updated Lesion Dynamics Table in the NeuroQuant MS report, providing key insights into lesion burden:
- Prior lesion burden = Stable + Shrinking (Represents the sum of Stable and Shrinking lesions)
- Current lesion burden = Stable + New + Enlarging (Represents the sum of Stable, New, and Enlarging lesions.)
A New Way to Visualize Change
The colors used in the visual output enhance the clarity of lesion change data:
- Red: New lesions
- Orange: Enlarging lesions
- Green: Stable lesions
- Blue: Shrinking lesions
Customization for Your Needs
We’ve also introduced configurable parameters for enhanced flexibility. You can now configure the minimum voxel count for thresholding absolute change and adjust percent volume change. This color-coding allows for quick identification and analysis of lesion changes over time.
This update to NeuroQuant MS provides a more straightforward and informative way to track and understand lesion dynamics, enhancing the value of NeuroQuant in clinical practice.
For more detailed information on thresholds, current customers can refer to the NeuroQuant User Manual.
