Cortechs.ai | NeuroQuant PET FDG Report

NeuroQuant PET FDG Report

FDG Report

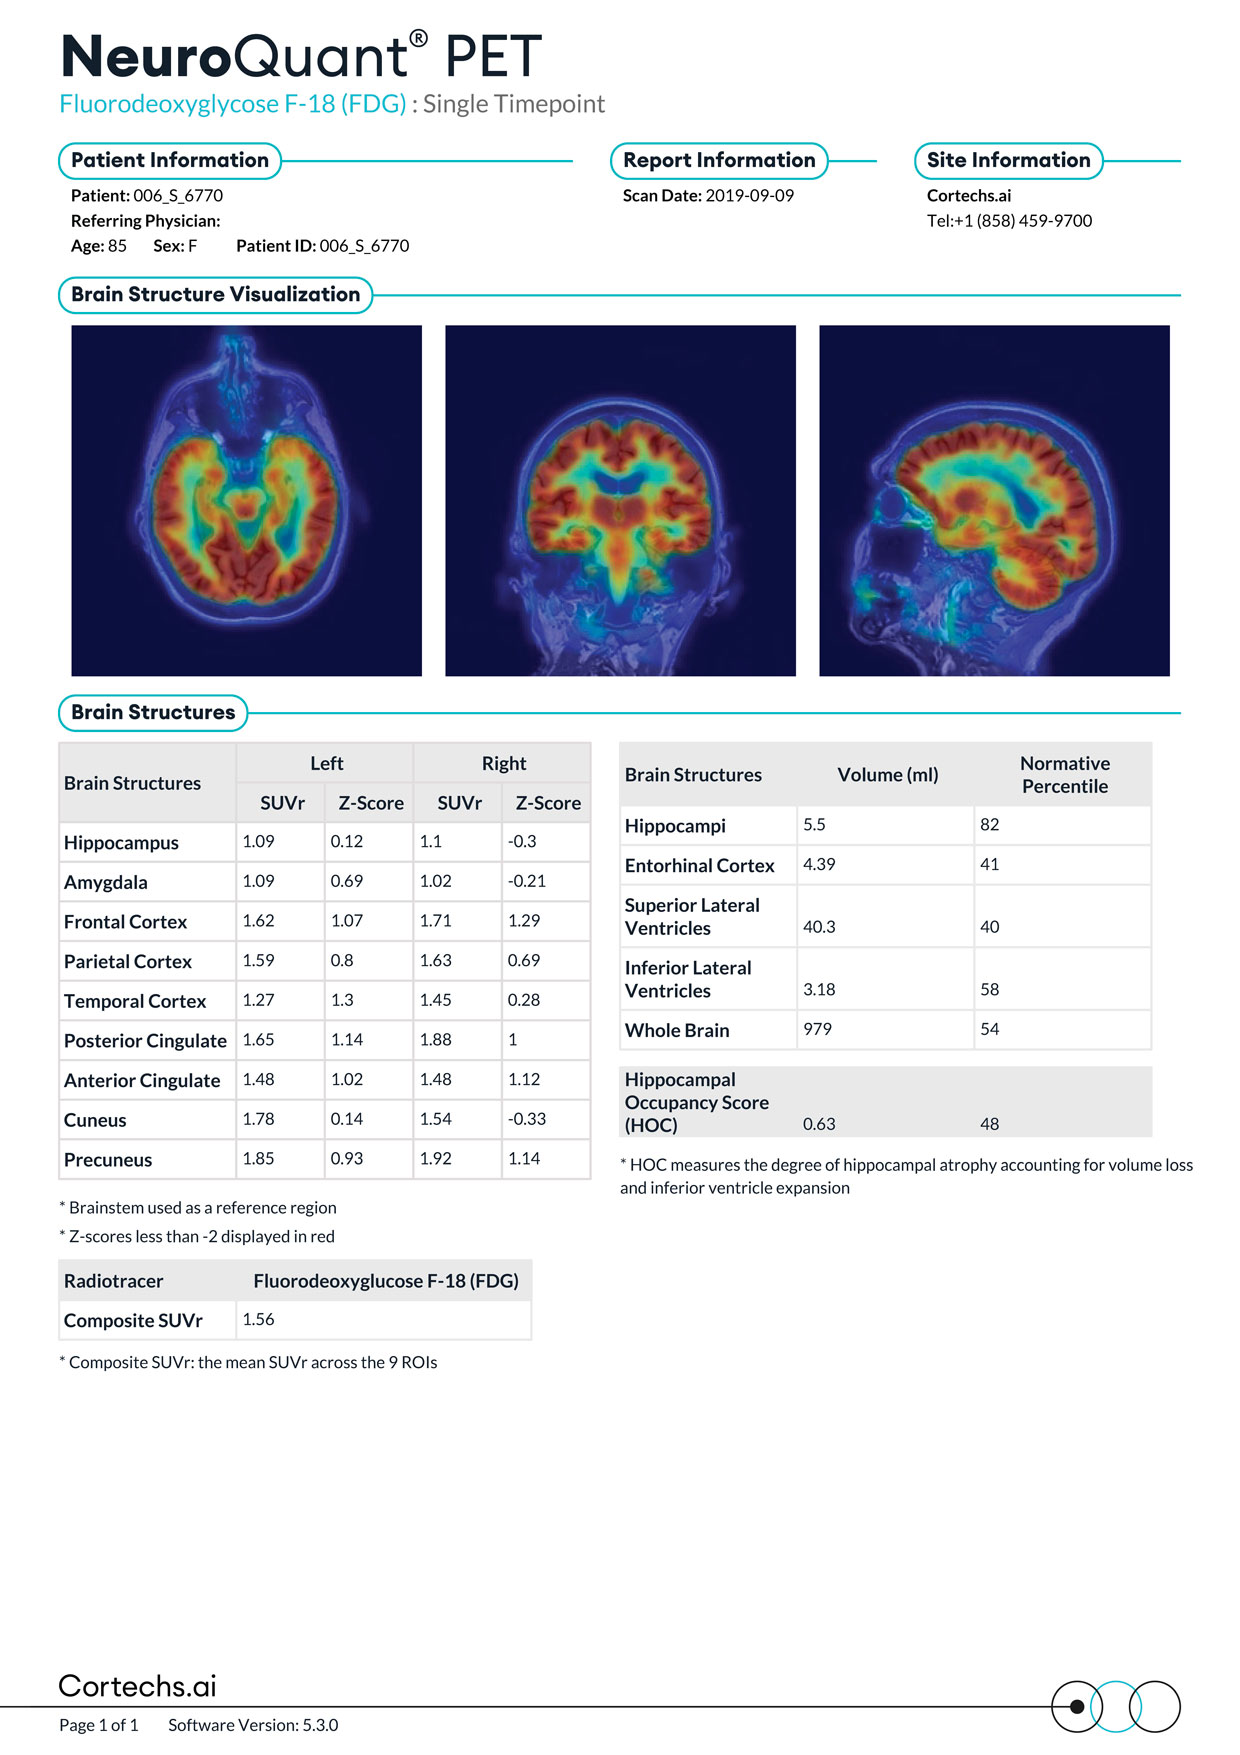
The NeuroQuant PET FDG Report automatically quantifies metabolic tracer bindings localized to brain structures. Visual and statistical comparisons of each normalized regional PET tracer value are then compared to normative population data.

Hover over the blue icons to view detailed information about report.

Cortechs.ai|NeuroQuant PET FDG Report

Patient information, referring physician, scan date, and site information.

Brain Structure Vizualization: PET/MR fused images displaying hypometabolism in the axial, coronal, and sagittal planes.

Brain Structures: SUVR and z-score by 9 regions of interest related to dementia (left) and 5 structure volumes and normative percentiles (right).

Scroll to Top