By
Cortechs.ai
2 mins
Weidong Luo [1], Yu Miao [3], Sebastian Magda 1, Aziz M.Ulug [1,2], Robert K. Haxton [1], Robert Melton [1], Linh Le [1,3], Chris Airriess [1]
[1] Cortechs.ai Inc., [2] Bogazici University, [3] University of California, San Diego
Introduction
Autism spectrum disorder (ASD) is a neurodevelopmental brain disorder characterized by symptoms
such as diminished reciprocal social skills. Previous studies showed that people with ASD may have
different neuroanatomy such as larger gray matter volumes. Further studies revealed enlargements and
reductions of various brain structures in ASD subjects. Brain volumetric information might be used to
create a valid machine learning model to help clinicians and researchers understand the relationship
between ASD and neuroanatomy.
Hypothesis
Brain volumetric measurements can be used to differentiate autism subjects from normal subjects.
Methods
A cohort of sixty-nine (all males, 8-16 years old) ASD subjects’ brain MRI images were acquired from the National Database for Autism Research (NDAR). 386 (194m, 192f, age-range 3-21 years old) age
compatible normal subjects from Pediatric Imaging, Neurocognition, and Genetics (PING) database
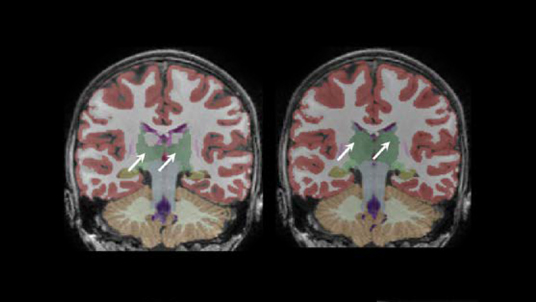
managed by the UCSD Center for Human Development (CHD) included in this study. Data included age, gender, and T1-weighted MRI scans. All data had been processed by NeuroQuant (Cortechs.ai Inc, San Diego, CA 92130), a fully automated brain segmentation software tool.
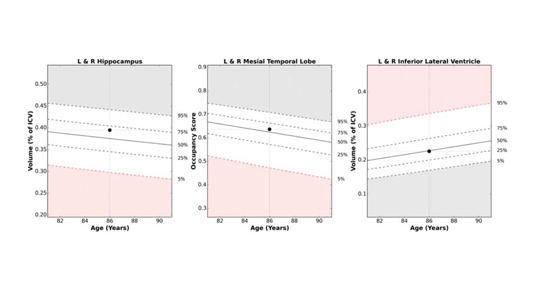
NeuroQuant uses a probabilistic Bayesian classification method and dynamic atlas technique for brain
segmentation. NeuroQuant outputs 57 structure volume measurements normalized by intracranial
volume (ICV). Random forest algorithm was implemented for modeling and 2/3 data were randomly
picked-up for training and the rest of the data were used for testing. Random Forest algorithm is a
widely used machine learning algorithm that combines thousands of randomly generated decision trees.
Due to the imbalance between normal and autism data set, the random forest algorithm is set to be
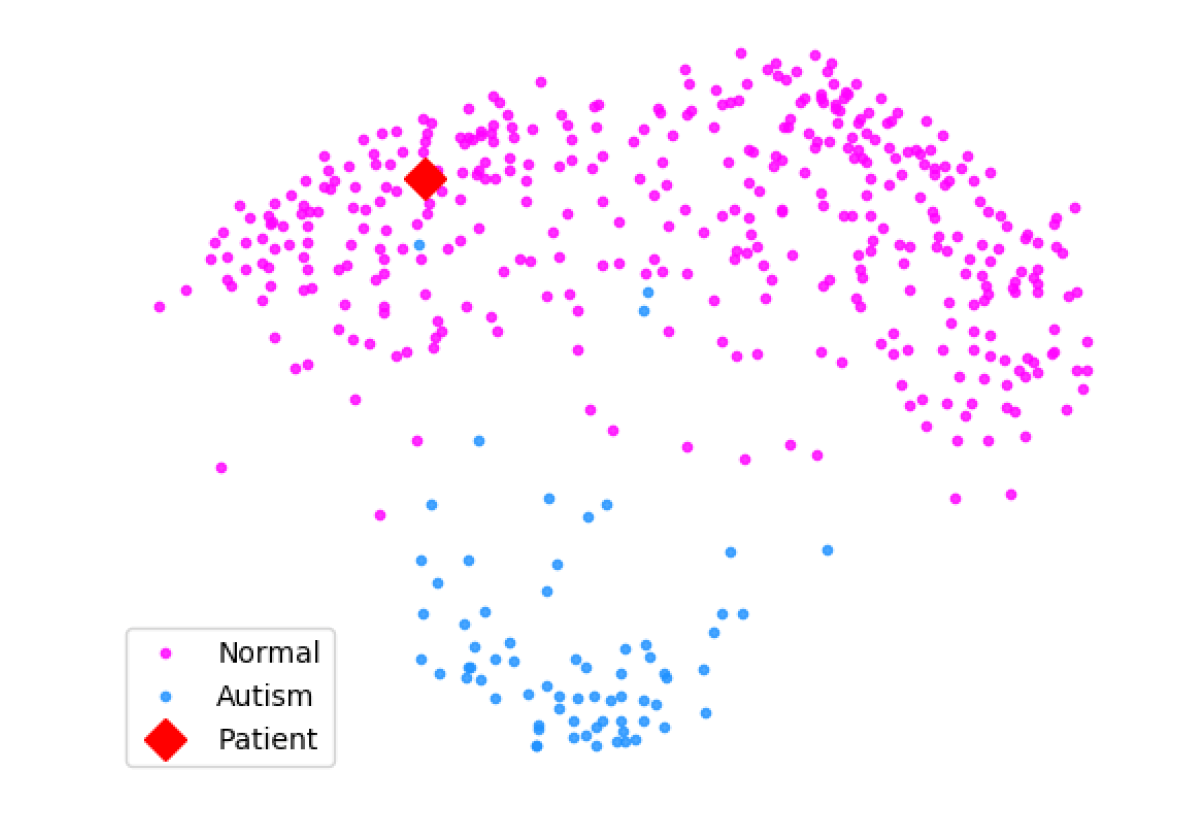
aware of this imbalance. In order to help the reader to visualize the relationship, we plot the proximity matrix. Multidimensional scaling implemented on this similarity can be used to divide the original data points into groups for visual exploration.
Results
The autism classification model based on random forest algorithm and brain segmentation showed high Area Under Curve (AUC) 0.97.
The key parameter of the model is shown as follows:
Precision Recall F1-score AUC
Normal 0.94 1.00 0.97 0.97
Autism 1.0 0.70 0.83
The top six features in terms of importance are shown as Frontal Poles, Cerebral White Matter,
Transverse Temporal, Inferior Frontal, Temporal Poles and Hippocampi. In order to illustrate the visual
relationship of the autism and normal subjects, we plotted the proximity matrix after multidimensional scaling and also used a normal subject outside of the training and test data pool. The plot showed the normal and autism data were well separated. The individual test patient data that is free of autism is located well within the normal data cluster.
Figure 1, Plot of data similarity after multidimensional scaling
Conclusion
This study showed the brain volumetric information can effectively be used for creating a machine
learning model that can classify the normal and autism subjects.
Statement of Impact
The machine learning model based on rain structure volumetric information extracted from T1 weighted structure MRI might help clinicians to identify those who are ASD and help them to get better treatment.
Keywords
Autism spectrum disorder, magnetic resonance imaging, Random Forest, machine learning, brain
segmentation.
Presented at the SIIM 2020 Annual Conference
Share